Incident Monitoring Checklist for IT Teams
If users tell you about outages before your tools do, your monitoring setup has a gap. I’d use this checklist to make sure every service has an owner, every alert has a severity, every contact path works, and every incident leads to a fix.
Here’s the short version:
- I start with scope: which apps, devices, SaaS tools, and dependencies I monitor
- I assign one owner or team to each asset
- I connect Google Workspace signals, like suspicious sign-ins and phishing alerts, to the same incident flow
- I tune alert rules with 30 days of data so the team gets fewer false alarms
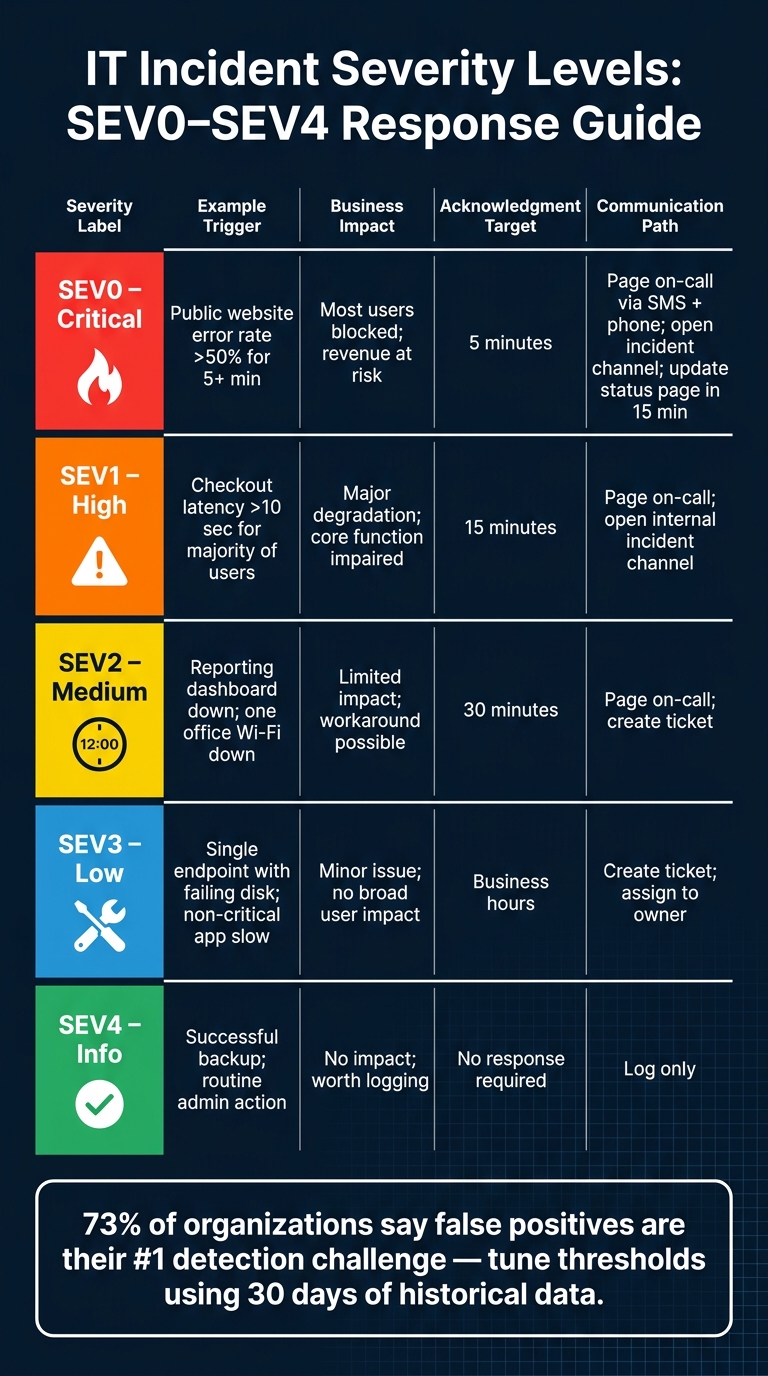
- I map alerts to SEV0-SEV4 so response times are clear
- I test paging, SMS, email, chat, and escalation paths
- I compare IT asset inventory to live monitoring to find missing devices or services
- I review TTD, TTA, and TTM after incidents and turn gaps into tracked work
A few numbers stand out. One team cut alert volume by about 90%. Another cut Sev. 1 and 2 incidents by about 62%. On the flip side, 73% of organizations in a 2025 SANS survey said false positives were their top detection problem. That tells me one thing: monitoring is not just about more alerts. It’s about the right alerts, sent to the right people, at the right time.
In plain terms, this article is a step-by-step check for scope, rules, contacts, testing, and review so your IT team can spot issues early and respond with less noise.
IT Incident Severity Levels: SEV0–SEV4 Response Guide
How to Audit Incident Management - Top 10 audit check points (2020)
sbb-itb-c68f633
1. Define Monitoring Scope, Asset Ownership, and Workspace Signals
Start by deciding what you monitor and who owns each item before you turn on alerts.
Inventory Critical Services, Devices, and Dependencies
Your monitoring scope should include the systems that keep the business running: apps, APIs, databases, network gear, servers, endpoints, identity systems, and core SaaS tools.
For each asset, attach four fields:
- Owner or team - use a named person or clearly assigned team, not a group alias
- Business criticality - Mission-Critical, High, Medium, or Low
- Environment tag - Production, Staging, or Development
- Dependency notes - upstream and downstream systems
Example: Payments Team; Network Ops; depends on Identity Provider and PostgreSQL; used by Customer Portal.
Review the asset catalog after major changes and on a set schedule. That step matters more than it sounds. A production asset with no health checks is a blind spot. A retired asset that still fires alerts is just noise.
Add Google Workspace Admin Reports and Alert Center Signals
Google Workspace should feed into the same monitoring motion as the rest of your stack.
Alert Center includes phishing, malware, suspicious sign-ins, leaked passwords, domain exports, and admin password resets. Admin console reports add login activity, app access patterns, and email usage anomalies.
Each signal type should point to a response team. For example, a single suspicious sign-in that passes MFA is often Medium for Security. Multiple high-risk sign-ins on admin accounts, or a broad phishing campaign, should route as High or Critical with immediate escalation to the Security team. Gmail or Meet degradation during U.S. business hours will often rate as High for IT Operations, especially when customer-facing work is affected.
Send these alerts to a monitored distribution list, such as security-alerts@yourdomain.com, instead of personal inboxes. Then route them by severity and owner so they follow the same response path as infrastructure alerts.
Use Asset Records to Close Coverage Gaps
A current asset catalog turns alerts into something the on-call engineer can act on. When an alert links to an asset record, the responder can see the owner right away, confirm the environment, check dependent services, and review past incidents tied to that same asset. That cuts triage time.
AssetRemix from AdminRemix keeps asset records and related ticket history in one place, so past incidents on the same asset are visible when a new alert fires. During monitoring audits, teams can compare the AssetRemix catalog against monitored entities to find gaps, such as devices or services with no checks assigned.
In Chromebook-heavy environments, Chromebook Getter can export enrolled device metadata, including status, last sync time, organizational unit placement, and compliance data, straight into Google Sheets. That makes it much easier to find Chromebooks that exist in Google Admin but are missing from endpoint monitoring, or devices sitting in the wrong organizational unit.
Use this scope and asset data to set alert thresholds and severity rules next.
2. Configure Alert Rules, Thresholds, and Severity Mapping
Turn your defined scope into alert rules that fire when something is wrong and stay quiet when things are fine. That sounds obvious, but this is where a lot of teams get buried in noise.
Set Alert Conditions and Tune Thresholds
Your alerting should cover six core categories:
- Availability: uptime checks for web apps, APIs, VPN gateways, directory services, and SSO providers
- Latency: for example, 99th percentile API latency ≤ 800 ms or database query latency ≤ 200 ms during business hours
- Errors: HTTP 5xx percentage, application exception rate, and failed login attempts
- Resource limits: CPU, memory, disk I/O, storage, and network bandwidth, with separate thresholds for production and non-production
- Security events: impossible travel logins, mass account lockouts, elevated OAuth scopes, and suspicious file sharing patterns
- Device health: offline laptops, RAID faults, outdated OS or patch levels, and critical hardware errors
Set thresholds using at least 30 days of historical data. Split that data by environment and by business hours versus after-hours. A threshold that makes sense at 2:00 p.m. on a Tuesday may be useless at 2:00 a.m. on a Sunday.
False positives are one of the biggest problems in detection and response. A 2025 SANS Detection & Response survey found that 73% of organizations said false positives were their top detection challenge, and more than 60% said they happened frequently or very frequently. That’s a big deal. If your team gets paged for harmless blips, people stop trusting the alerts.
To cut down on noise, use persistence windows, recovery thresholds, and deduplication. And here’s a simple gut check: if an alert fires without action more than twice in 30 days, tune it or remove it.
Tag each alert with:
- service
- component
- environment
- owner
- severity
- runbook link
Once your thresholds are set, assign severity levels and response targets to each alert.
Map Alerts to Severity Levels and Response Targets
Use a SEV0-SEV4 model tied to user impact and business disruption. The point isn’t just labeling alerts. It’s making sure the response matches the actual damage.
| Severity | Example Trigger | Business Impact | Acknowledgment Target | Communication Path |
|---|---|---|---|---|
| SEV0 – Critical | Public website error rate > 50% for 5+ minutes | Most users blocked; revenue at risk | 5 minutes | Page on-call by SMS and phone; open incident channel; update status page in 15 minutes. |
| SEV1 – High | Checkout latency > 10 seconds for majority of users | Major degradation; core function impaired | 15 minutes | Page on-call; open internal incident channel. |
| SEV2 – Medium | Reporting dashboard unavailable; one office Wi-Fi down | Limited impact; workaround possible | 30 minutes | Page on-call; create ticket. |
| SEV3 – Low | Single endpoint with failing disk; non-critical app slow | Minor issue; no broad user impact | Business hours | Create ticket; assign to owner. |
| SEV4 – Info | Successful backup completion; routine admin action | No impact; worth logging | No response required | Log only. |
Only page people for alerts that need immediate human action. That’s the rule. Warning-level issues should go to Slack or a ticketing system, and informational events should be kept out of paging entirely.
If an alert turns out to have a bigger effect than expected, reclassify it. A low-level alert that knocks out a key workflow shouldn’t stay low just because the spreadsheet said so.
Next, map each severity level to a contact path and escalation rule.
3. Build Contact Paths, Escalation Rules, and On-Call Coverage
Severity levels only matter if alerts reach the right person fast. That chain falls apart when contact info is old, timers are vague, or backup coverage was never checked.
Document On-Call Contacts and Notification Channels
Use the SEV labels from the previous step to send each alert to the right person or role.
For every critical service, record the owner, backup, time zone, primary and backup contacts, working hours, and supported systems. Include phone, SMS, email, chat, and paging details. Store this inside your incident management or ITSM platform so routing and ticketing stay aligned.
For U.S.-based teams working across time zones, spell out shifts with clear labels, like 8:00 p.m.–8:00 a.m. ET. Plan weekend and holiday coverage ahead of time. Route alerts to roles instead of named people, so coverage doesn’t fall apart when staffing changes.
If you manage Chromebook or Google Workspace assets, use AssetRemix to connect devices, services, owners, and help desk queues.
Each service should have:
- a primary contact
- a backup contact
- an executive fallback
After the roster is up to date, tie each alert path to an escalation timer.
Match Severity Levels to Escalation Paths
After contacts are set, assign the order and timing for each escalation.
Define who gets paged first, how long the system waits, and who joins if the issue still isn’t fixed. Escalation paths should never hit a dead end. If the primary on-call doesn’t acknowledge the alert, the system should move to the secondary, then the team lead, and for critical incidents, the incident commander.
| Severity | First Contact | Backup Path | Escalation Timer |
|---|---|---|---|
| SEV-1 – Critical outage | Paging app + SMS to the on-call engineer | Voice call to the secondary on-call, then team lead | Escalate after 5 minutes, then again after 10 minutes |
| SEV-2 – Major degradation | Paging app to the on-call engineer + Slack channel notification | SMS to the secondary on-call | Escalate after 15 minutes |
| SEV-3 – Minor impact | Ticket creation + email to the team queue | Daily summary in team chat | Escalate to the team lead if unresolved after 24 hours |
| SEV-4 – Informational | Email or dashboard only | None | None |
For Google Workspace incidents, include Alert Center actions like suspend user, block device, and investigate alert so responders can see which fixes are available right from the Admin console. If paging fails, fall back to personal cell numbers or a written call tree.
4. Validate Device Coverage, Test Alerts, and Run Simulations
Once scope, rules, and escalation are set, make sure the whole system works in practice. That means checking every monitored asset, every Workspace signal, and every contact path before go-live and again after any major monitoring change.
Check Monitoring Coverage Across Devices and Services
Start by comparing the asset inventory from Section 1 with what your monitoring platform is actually watching. Review assets by group: managed laptops and desktops, Chromebooks, physical and virtual servers, network equipment, cloud services, APIs, and user-facing services like Google Workspace. For each group, confirm three things: an agent or integration is in place, the device or service appears in the monitoring tool’s target list, and metrics and logs are coming in.
If you manage a Chromebook fleet, compare Google Admin exports - or Chromebook Getter exports - against your endpoint monitoring list. For Google Workspace, check that Alert Center rules are active and that notifications go to the correct admins. If the Alerts column shows a dash, that rule will not generate an Alert Center alert.
Write down every gap in the same format so nothing slips through the cracks.
Managed laptops: 1,000 in inventory / 980 monitored; 20 missing.
After you’ve logged the gaps, test alert routing.
Trigger Test Alerts for Every Severity Level and Contact Path
Test each severity path on its own. For SEV1, make sure phone calls and SMS reach the right on-call engineer. For SEV2, verify SMS, email, and chat delivery. For SEV3 and SEV4, confirm that email and chat messages go to the right people.
Label each test alert so it’s impossible to confuse with a live issue. For example: [TEST] SEV2 – CRM Web App Latency Check. Then record what happened:
- Delivery time
- Routing accuracy
- Message clarity
- Whether acknowledgment worked as expected
Fix any failure now, not during an actual incident when time is tight.
Once routing checks out, move on to simulations.
Run Tabletop or Live Incident Simulations
Use checklists, walkthroughs, and simulations together. A tabletop exercise lets the team work through a realistic incident without touching production. The goal is to verify response targets, escalation timing, and handoff quality against the severity and escalation model from Sections 2 and 3.
Choose scenarios based on your highest-risk services. A solid starting set includes a production payment API returning 500 errors (SEV1), Google Workspace sign-in failures affecting a subset of users (SEV2), and a Chromebook fleet dealing with intermittent Wi‑Fi disconnections in one region (SEV3). After each exercise, mark detection, escalation, communication, and handoff as pass, fail, or follow up. Assign an owner and due date to every open item, then rerun the scenario after fixes. If gaps remain, carry them into the post-incident review.
Feed failed tests and open gaps into the post-incident review.
5. Review Monitoring Performance After Incidents
After every serious incident, review what happened and pinpoint the monitoring gap that let the issue spread or stick around longer than it should have. Start with the incident record, test-alert results, and escalation logs. Then compare what should have happened with what actually happened.
Review Detection Timing, Alert Accuracy, and Escalation Results
Build a clear timeline for the incident:
- When the incident started, based on logs or error spikes
- When the first alert fired
- When a responder acknowledged it
- When the issue was resolved
From those timestamps, calculate time to detect (TTD), time to acknowledge (TTA), and time to mitigate (TTM). Then compare those numbers against your TTD, TTA, and TTM targets.
If users reported the issue before any alert fired, treat that as the top finding. That's a strong signal that your monitoring coverage has a hole, and it should trigger a focused audit right away.
Next, review where alerting and escalation fell short. Record:
- False negatives
- Late alerts
- Missed escalations
- Noisy alerts that needed no action
Each one points to a different kind of fix. You may need new monitors, tighter or looser thresholds, updated on-call data, or less sensitive alert rules.
Document Changes and Track Action Items to Completion
Once you've identified the gaps, turn each fix into tracked work. Log every finding in the ticketing system with an owner, due date, and retest date. Link each item back to the incident record so nothing gets lost.
A simple before-and-after table makes the record easy to audit:
| Incident Date | Affected Service | Issue Found | Before | After | Owner | Retested |
|---|---|---|---|---|---|---|
Cross-check affected assets in AssetRemix to confirm the owner, criticality, and monitor coverage. If asset records are wrong, alerts can end up going to the wrong person.
Run a monthly check of open actions, alert rules, and contact data.
FAQs
How often should we review our monitoring setup?
Use a tiered review schedule to keep things under control.
- Monthly spot checks: orphaned accounts, unassigned devices, and failed automation workflows
- Quarterly reviews: license usage, organizational unit mappings, and policy baselines
- Annual full-process checks: API scopes, OAuth configurations, and admin roles
Regular audit log and system report reviews help you stay ahead of risks, suspicious activity, and configuration drift.
What should we do first if users report issues before alerts fire?
First, check the Google Workspace Audit and Investigation tool. Filter the logs by the affected user’s email, event name, or date range to pinpoint the root cause.
That review helps you figure out whether you’re looking at a known issue or a new threat. From there, tighten your monitoring with custom reporting or activity rules so similar incidents set off alerts next time.
How can we reduce false positives without missing real incidents?
Start with new rules in audit-only mode. That lets you log possible violations and tune settings before you turn on live alerts.
Focus first on high-impact security and operational signals. Use Time Over Threshold rules to catch issues that stick around instead of one-off spikes. Then review alert logs on a regular basis and cut noisy, low-impact notifications, while keeping actionable alerts for business-critical events.