Ultimate Guide to IT Resource Allocation and Performance
Bad IT allocation hurts fast: more backlog, slower response, and wasted spend. In this guide, I’d boil it down to five moves: know what you have, measure usable capacity, rank work by value and risk, track a small set of metrics, and rebalance on a fixed schedule.
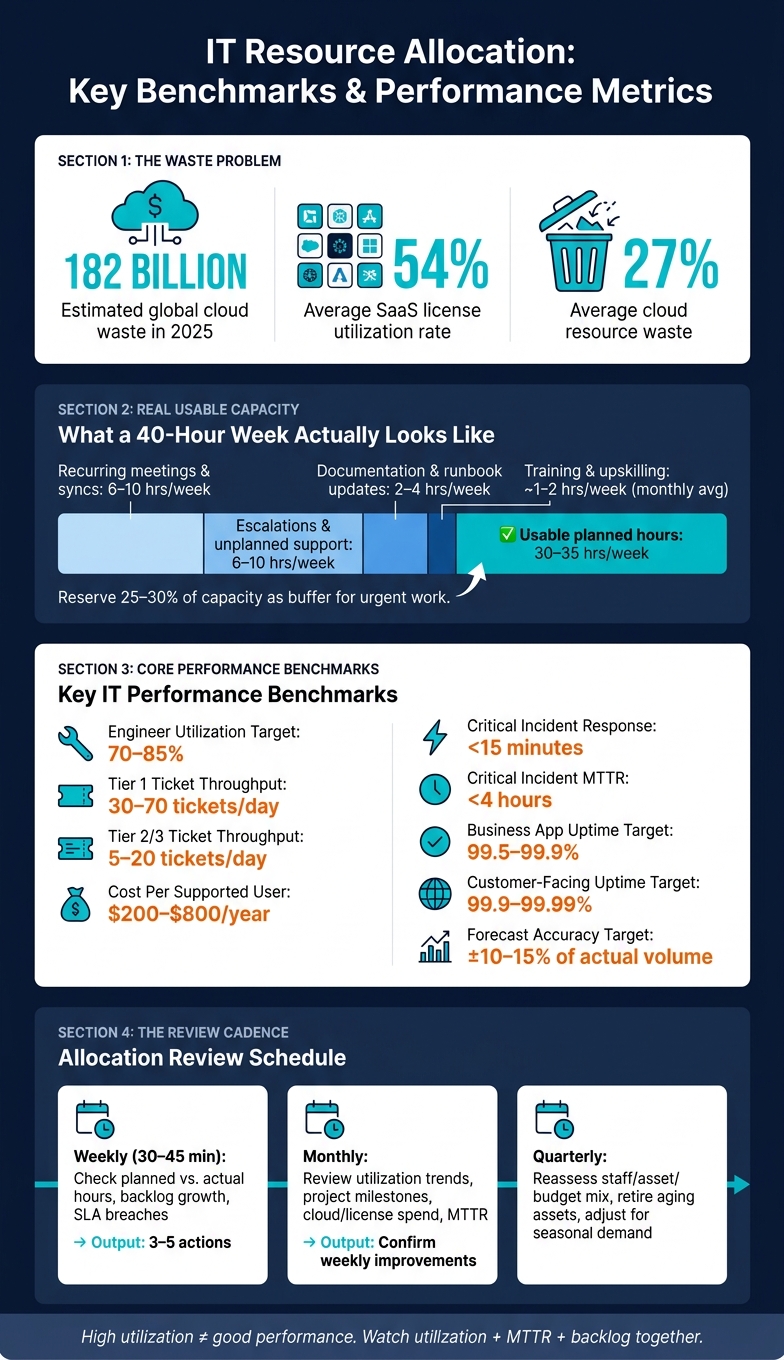
Here’s the core idea in plain English: if I assign people, budget, devices, licenses, and cloud resources without data, performance gets uneven. That shows up in missed SLAs, project delays, and spend that doesn’t help the business. The article points to big waste numbers too, including about 54% SaaS license use on average and 27% cloud waste, equal to roughly $182 billion in 2025.
If I wanted the short version, it would be this:
- Inventory first: track staff time, devices, software, vendors, backlogs, and critical systems
- Separate key terms: allocation is assignment, capacity is total output, utilization is how much of that output gets used
- Plan with real capacity: a 40-hour week often means only 30–35 usable hours
- Leave room for urgent work: keep 25%–30% of capacity set aside
- Rank work with rules: score requests by business value, risk, and service impact
- Watch a few numbers: utilization, throughput, response time, MTTR, uptime, cost per user, and forecast accuracy
- Review often: weekly for short-term shifts, monthly for trends, quarterly for bigger changes
One point stands out: high utilization is not the same as good performance. If utilization is high and backlog and MTTR are climbing, I’m likely over-assigning the team, not improving output.
This article is a plain guide to turning IT allocation into a repeatable process tied to service levels, team workload, and cost control.
IT Resource Allocation: Key Benchmarks & Performance Metrics
What Methods Are Used to Optimize Resource Allocation? | The Project Manager Toolkit News
sbb-itb-c68f633
IT resource allocation basics
Before you allocate anything, write down what you have. Resource allocation gets a lot easier when inventory, service priority, and constraints are tracked in one place instead of scattered across tools and notes.
Build a complete resource inventory
A complete IT resource inventory should cover six core categories: staff capacity, devices, software, ticket backlogs, vendors, and critical systems. For each item, record ownership, location, status, and service impact.
For devices, track asset ID, device type, lifecycle stage, and assigned user. For software, list license type, seat count, active usage, and renewal date. For example, if you have 500 licenses and 430 active users, you can see open capacity right away. For staff, calculate net available hours by subtracting meetings, training, and admin work from contracted hours.
Update the inventory during installs, removals, onboarding, offboarding, and major environment changes. AdminRemix links devices, users, and support records. Chromebook Getter and User Getter can bulk-update Chromebook and Google Workspace metadata in Google Sheets.
Once the inventory is in place, map each item to the services it supports.
Map resources to critical services
Start by defining your service catalog: endpoint management, identity and access management, help desk support, cybersecurity operations, and collaboration platforms. Then assign each service a criticality tier.
From there, map staff, devices, software, and vendor contracts to each service so gaps show up before they turn into incidents. This is especially useful when capacity gets tight, because it helps you protect Tier 1 services first.
After service criticality is clear, you can look at the limits that shape allocation.
Identify constraints before assigning work
Constraints often sit outside the inventory, so document them separately. Skill gaps affect who can take certain work. Maintenance windows affect when work can happen. Compliance rules limit who can access systems, when changes can be made, and what approvals are needed, so record those as required steps in the change process. Seasonal spikes usually show up in past ticket and load data. Contract and license limits cap how many users, calls, or seats can be supported at a given time.
Common constraints include:
| Constraint Type | Impact on Allocation |
|---|---|
| Skill gaps | Limits which staff can handle specific tickets or projects |
| Maintenance windows | Blocks scheduling changes or deployments during freeze periods |
| Compliance requirements | Restricts access, timing, and approval paths for certain systems |
| Seasonal spikes | Reduces available capacity for project work during peak periods |
| Contract/license limits | Caps how many users, calls, or seats can be supported at a given time |
Those limits feed the capacity forecast in the next section.
Capacity planning for IT workloads
Constraints shape capacity planning. From there, the job is pretty simple: estimate demand, then compare it with the capacity you can actually use.
Forecast demand using baseline workload data
Start with 12 months of historical data so you can spot repeat peaks and turn them into monthly demand estimates. Pull ticket volume by category, including incidents, service requests, and changes. Look at incident counts by priority, project intake records, device refresh cycles, and onboarding numbers. Then find the pattern: when do spikes happen, and what’s causing them?
Next, line that up with your business calendar. Your own peak periods, paired with known business events, give you a solid way to forecast repeat demand. That forecast becomes the starting point for your capacity calculation.
For day-to-day operational work like device refreshes and onboarding, estimate effort per unit using time-tracking data, then multiply that by expected volume. Use AdminRemix AssetRemix, Chromebook Getter, and User Getter to bring asset and user data together.
Calculate available capacity after overhead
A 40-hour week almost never means 40 usable hours. Once you account for meetings, training, documentation, and escalations, many teams are left with only 30 to 35 hours per person, or about 80 to 90 hours per month, for planned work.
| Overhead Category | Typical Time Commitment |
|---|---|
| Recurring meetings and syncs | 6–10 hours per week |
| Training and upskilling | 4–8 hours per month |
| Documentation and runbook updates | 2–4 hours per week |
| Escalations and unplanned support | 6–10 hours per week |
Multiply that across the team to get total monthly capacity. Then subtract the hours already tied up in operational run work. What’s left is the time you can assign to projects and changes.
Planned capacity doesn’t tell the whole story until urgent work is built in.
Reserve buffer capacity for urgent work
Set aside 25 to 30% of total capacity as buffer for urgent work. If you skip that step, urgent tasks tend to blow up the plan, force nonstop reprioritization, and drag down service delivery. The best way to size that buffer is to use your historical data. If urgent work took an average of 20 to 25% of team hours over the last 12 months and climbed to 35 to 40% in heavier months, then a 25 to 30% buffer is a defensible target.
In the monthly capacity plan, show buffer as its own line item next to planned work, not as “empty” time. That framing matters. It shows the buffer is there to protect incident response SLAs and security needs. If buffer time goes unused, pull work from a prioritized backlog, like automation, documentation, or monitoring.
Capacity planning sets the ceiling. Priority rules decide where that time goes first. With capacity defined, the next move is deciding what gets it first.
Priority-based allocation methods
Capacity planning tells you how much work your team can take on. Priority-based allocation decides what gets that capacity first.
That split matters more than it sounds. If you don't have a clear way to rank work, decisions often go to the loudest stakeholder in the room. And once that starts happening, resources drift away from actual business need. Prioritization is the step that turns raw capacity into performance you can track.
Rank work by value, risk, and service impact
A practical way to score work is to review each request across three dimensions: business value, risk, and service impact. Each one can be broken into specific criteria and scored on a 1–5 scale. The point is simple: protect SLA-critical work, cut waste, and keep core services steady.
Business value covers expected financial effect, such as projected revenue gain or cost avoidance in USD, alignment with company initiatives like digital transformation, and regulatory obligations. A score of 5 means the work prevents major compliance exposure or a material revenue loss.
Risk looks at security exposure, like unpatched systems or missing MFA on critical services. It also includes dependency risk, such as single points of failure in infrastructure or identity systems, plus operational risk, like possible downtime for tier-1 services such as payment gateways or EHR platforms.
Service impact measures user reach, service tier, and whether the system affects external customers or only internal back-office functions.
Once you've scored the work, apply weights based on your team's priorities. A security-focused team, for example, might use:
- 40% risk
- 40% business value
- 20% service impact
That weighted score gives you a ranked list that's documented and repeatable, instead of one shaped by hallway pressure or last-minute escalation.
Before you score discretionary work, separate out mandatory work. Regulatory remediation, audit findings, and critical security patches should enter the queue as required work ahead of everything else. Otherwise, it's far too easy for compliance items to get buried under feature requests.
Choose the right allocation model for the situation
No single model works for every IT workload.
| Allocation Model | Best Use Case | Strengths | Tradeoffs | Decision Inputs |
|---|---|---|---|---|
| Value-based | Growth initiatives, digital transformation, innovation projects | Aligns resources to business outcomes and ROI | Can deprioritize risk and compliance work | Business cases, ROI estimates, strategic roadmaps |
| Capacity-based | Service desk operations, infrastructure with fixed headcount, high-volume routine work | Maximizes throughput within known constraints | Less emphasis on strategic or risk priorities | Utilization metrics, ticket volume, SLA targets |
| Risk-based | Post-incident remediation, regulatory audits, heightened security posture | Directly reduces security, operational, and compliance exposure | Slower visible business value delivery | Risk assessments, vulnerability scans, compliance requirements |
Pick the model that best protects the outcome you need most, whether that's throughput, risk reduction, or business value.
In practice, most IT teams don't stay in one lane. They mix models. After a security incident, for instance, it makes sense to shift toward risk-based allocation so remediation work moves first. Once things settle, teams often tilt back toward value-based work while using capacity controls to protect support coverage. That's usually the more grounded approach.
Use governance to reduce ad hoc allocation
Scoring only works when the process behind it is consistent. If governance is weak, requests come in through side channels, the most persistent people get special treatment, and the scoring model gets ignored.
A few controls help close that gap:
- Approval rules tied to work size and type. For example, projects above a defined USD threshold may need IT director sign-off, while risk-related initiatives may need security leadership approval.
- Clear ownership by role and domain. That might mean an operations lead for infrastructure work, an application owner for system-specific requests, and a security officer for remediation.
- A standard intake form in your ITSM or project management tool. It should capture business impact, affected services, estimated effort, user reach, and compliance context before evaluation starts.
- Scheduled review points, including weekly allocation reviews for near-term changes, monthly portfolio checks for trend review, and quarterly risk reviews to reassess security and compliance posture.
When critical incidents spike in the middle of the month, the weekly review is where that gets handled, not through an off-process request that reshuffles the queue. Use the resulting priority list as the baseline for tracking throughput, response time, and cost efficiency.
Performance metrics that matter
Use these metrics to check whether your allocation model is improving throughput, speed, and cost. If you don't measure, you're guessing. And when you're guessing, it's easy to miss bottlenecks or assume things are getting better when they aren't.
Track utilization, throughput, response time, and cost efficiency
Keep your core metric set to 5–7 numbers so you can see both sides of the picture: how your team is being used and what users are feeling on the other end.
Start with one set of metrics that covers resource use and service results.
Capacity metrics show whether your team and budget are being used well:
- Engineer utilization: The percent of scheduled hours spent on assigned work. A common target for U.S. IT teams is 70–85% productive utilization.
- Ticket throughput: Tickets resolved per engineer per day or week. A Tier 1 help desk engineer may close 30–70 tickets per day. Tier 2/3 engineers often resolve 5–20 complex tickets.
- Cost per supported user: Total IT support spend divided by the number of users or managed devices. A common annual range for U.S. organizations is $200–$800 per user, depending on service scope and industry. If you're managing a large device fleet, tools like AdminRemix's AssetRemix can make this easier by linking asset inventory with cost and ownership data.
Service metrics show what users get from those allocation choices:
- Mean response time: Average time from ticket creation to first IT response. Critical incidents often target under 15 minutes. Standard requests usually aim for 1–4 hours.
- MTTR (Mean Time to Resolution): Average time from ticket open to closure. For critical incidents, enterprise benchmarks target under 4 hours. Standard incidents often aim for under 8 hours.
- Uptime/availability: The percent of time critical services stay available. Business-critical internal apps often target 99.5–99.9% monthly uptime, while customer-facing platforms often push toward 99.9–99.99%.
- Planning accuracy: How close planned workload estimates are to actual volume. A monthly ticket forecast within ±10–15% of actual volume is a solid starting point.
Capacity metrics tell you if you're using what you have well. Service metrics tell you if that effort is turning into the service level you want.
Leading indicators versus lagging indicators
Use leading indicators to spot trouble early. Use lagging indicators to confirm whether your allocation choices worked.
| Metric | Type | Focus |
|---|---|---|
| Engineer utilization | Leading | Resource load |
| Ticket backlog growth | Leading | Demand vs. capacity gap |
| Work-in-progress (WIP) volume | Leading | Queue pressure |
| SLA attainment | Lagging | Past service delivery |
| MTTR | Lagging | Resolution efficiency |
| Uptime/availability | Lagging | Infrastructure reliability |
| Cost per supported user | Lagging | Financial efficiency |
Leading indicators give you room to act. You can add coverage, shift work, or escalate before a threshold gets crossed. Lagging indicators look backward. They tell you whether the last round of decisions paid off. Strong IT teams watch both, but they step in based on the leading ones.
Read the warning signs in your metrics
Metrics almost never break one at a time. What matters is the pattern. That's where you see whether work, staff, or budget need to move to protect the priority model you've already set.
High utilization + rising MTTR + growing backlog is the clearest sign of over-allocation. People are busy, but work isn't moving out the door. In plain terms, demand has outgrown capacity, or the workload mix needs to shift.
Low utilization + backlog concentrated in one area usually points to poor allocation, not an overall staffing problem. The team has capacity. It's just sitting in the wrong place.
Stable uptime + rising cost per user is easier to miss. On the surface, service looks steady. Underneath, it costs more and more to keep it there.
Review the 5–7 core metrics every week, and read them as trends instead of isolated snapshots.
Monitoring and rebalancing resources
Metrics only help if you use them. Take the utilization, backlog, MTTR, and cost signals from the previous section and feed them into a simple review loop. The point is to spot drift early, before it turns into missed targets or overloaded teams.
Run reviews at three levels, each with a clear job and output:
- Weekly (30–45 minutes): Check planned vs. actual staff hours by work category, backlog growth, and SLA breaches from the past week. Output: 3–5 concrete actions.
- Monthly: Review utilization trends, project progress against milestones, cloud and license spend vs. budget, and service-level metrics like MTTR and availability. Output: confirm whether weekly changes are improving performance.
- Quarterly: Reassess the mix of staff, assets, and budget; retire or replace aging assets; adjust for new business initiatives or seasonal demand shifts.
Rebalance workloads, assets, and support coverage
When review data shows drift, rebalance staff, assets, or coverage through a documented change. Protect the highest-value, highest-risk services first. Start with the biggest gap, then make the smallest move that gets things back in line.
For staff and workload shifts, the most common fix is a temporary change in the split between reactive and planned work. If incidents are pushing project work off the table, change the ratio - for example, from 40/60 to 60/40 for a month - then review it again at the next weekly check-in. If lower-priority projects need to move, defer them on purpose. Don’t let them slide without a new date and a clear owner.
For assets, start with visibility. Before you buy new hardware, check whether underused devices can be moved where they’re needed. AdminRemix's AssetRemix centralizes asset records and lifecycle data, which makes it easier to spot hardware sitting idle or licenses that no one is using. For teams running large Chromebook fleets or Google Workspace environments, Chromebook Getter and User Getter support bulk device and user reassignments through Google Sheets. That can save a lot of time when you need to rebalance across departments at scale.
If workload shifts still don’t solve the problem, move to support coverage. Match shifts to actual peak demand, not guessed schedules. Pull incident timestamps and service usage logs to find your true busy hours, then rebuild coverage around that data. Also watch on-call alerts per person and overnight pages. If that load stays high, you likely have a coverage issue.
A good rule of thumb is to keep infrastructure utilization in the 70–80% range on critical nodes. That leaves enough headroom for demand spikes.
Conclusion: Build an allocation process tied to measurable performance
Treat allocation as a steady discipline. Inventory what you have, map it to priorities, track utilization, throughput, response time, and cost efficiency, and review on a fixed cadence so each rebalancing decision is checked against a measurable baseline.
FAQs
How do I measure true IT capacity?
Measure IT capacity from two angles: watch live hardware performance and review how assets are being used over time.
Start by tracking baseline metrics during peak usage. Focus on CPU, available RAM, disk latency, and network throughput. Those numbers show you what “normal” looks like when demand is high. From there, set alerts so your team can spot bottlenecks early instead of finding out after users start complaining.
Then pair that data with a centralized inventory tool like AdminRemix AssetRemix. It helps you find underused assets, track lifecycle and license usage, and plan future capacity based on business demand.
What’s a good IT utilization target?
For hardware, a healthy IT utilization target is generally above 90%. That helps keep budget from getting stuck in idle or underused devices.
To stay there, use asset data to match purchasing with your organization’s refresh cycles, onboarding needs, and growth plans. AdminRemix tools such as AssetRemix can help by giving you real-time visibility into utilization patterns.
How often should IT resources be rebalanced?
IT resources should be rebalanced on a steady basis, not by a fixed calendar. Real-time dashboards and asset use analytics help IT teams spot idle or weak-performing assets and move or tune them right away.
This work should be tied to what’s happening on the ground. Common triggers include onboarding and offboarding, hardware refresh cycles every three to five years, and the launch of new technical projects.