
Ultimate Guide to Hardware Performance Monitoring
Monitoring your hardware is essential to keep systems running smoothly. By tracking metrics like CPU usage, memory, disk health, and temperature, you can prevent failures before they happen. This guide explains key metrics to watch, how to set baselines, and practical tips for optimizing performance.
Key Takeaways:
- Why Monitor? Avoid downtime, detect issues early, and improve security.
- What to Track? CPU, memory, disk I/O, temperature, and network performance.
- How to Set Alerts? Use baselines and thresholds to identify abnormal behavior.
- Best Practices: Focus on critical alerts, automate responses, and analyze trends.
With a structured approach, you can ensure your IT infrastructure stays reliable and efficient.
Hardware Monitoring/Tweaking Software Guide
Key Metrics to Monitor
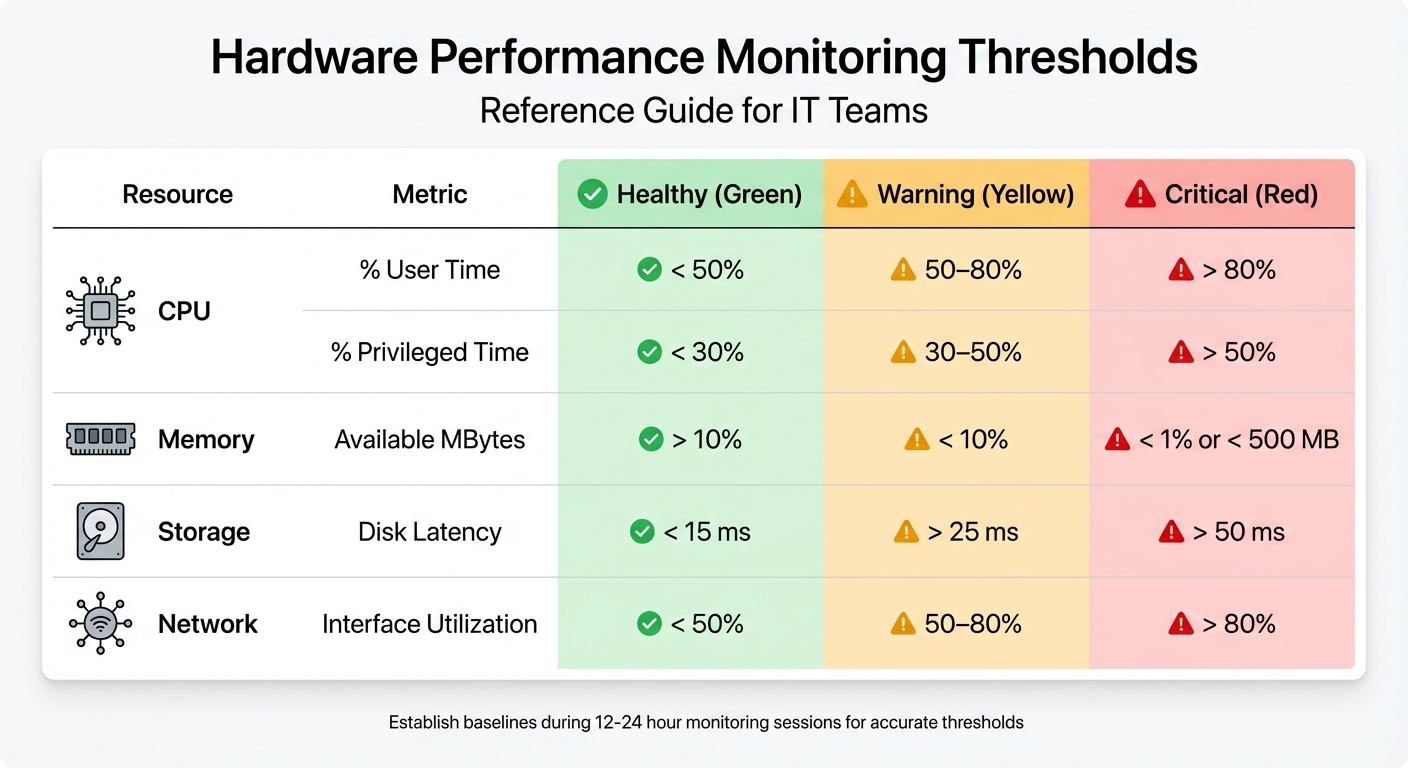
Hardware Performance Monitoring Thresholds: Healthy vs Warning vs Critical Levels
This section dives into the crucial metrics that help assess and maintain system health. Keeping a close eye on these indicators ensures smooth operations and helps prevent potential issues.
CPU and Memory Utilization
Keeping tabs on CPU performance is essential. Start with the % Processor Time to get an overall view of system load. For a deeper dive, check % User Time (application activity) and % Privileged Time (kernel operations). Ideally, % User Time should stay below 50%, while % Privileged Time above 25% could signal driver or hardware problems.
"A high percentage of privileged time, anything consistently above 25%, can usually point to a driver or hardware issue and should be investigated." – Ben Snaidero, MSSQLTips
Memory usage is another key area. Monitor Available MBytes to ensure at least 10% of total RAM or a minimum of 4 GB is free. The Pages/sec counter is also critical - values consistently above 50 pages per second indicate memory bottlenecks. For CPU performance, watch the processor queue length. If it exceeds 2–3 threads per core over extended periods, the system is likely under heavy CPU strain. By tracking these metrics, you can spot problems early and maintain system stability.
Disk I/O and Storage Capacity
Disk performance hinges on latency and throughput. Keep an eye on Avg. Disk sec/Read and Avg. Disk sec/Write - healthy disks typically maintain latency under 15 ms, while anything over 50 ms is a red flag. For reference, a standard 5,400 RPM hard drive reads a block in about 11 ms, but when latency spikes to 100 ms, the disk is overwhelmed.
The Disk Queue Length metric is also vital. A sustained average queue length over 2 indicates the disk is struggling to meet demand. Don't forget to monitor the S.M.A.R.T. status, which can provide early warnings of potential drive failures. Modern NVMe SSDs have lower latency baselines than traditional drives, so adjust thresholds accordingly. Beyond metrics, keeping an eye on environmental factors like temperature can help prevent physical damage to storage devices.
Temperature, Fans, and Power Supply
Environmental monitoring is crucial for protecting hardware. Excessive heat can damage components like hard drive platters, so tracking temperatures regularly can prolong their lifespan. Keep an eye on CPU and GPU temperatures (in degrees Fahrenheit), fan speeds (in RPM), and power consumption (in watts). High-performance components can tolerate temperatures up to 248°F before triggering emergency shutdowns.
"Monitoring temperature and power consumption prevents overheating and ensures proper cooling." – Lenovo
Fan speed is another important indicator. If fans are running at maximum RPM but temperatures remain high, it may be time for a physical cleaning to remove dust buildup and improve airflow. Additionally, monitor your power supply's utilization ratio to ensure it can handle peak workloads without causing instability. Ambient temperature sensors typically provide accurate readings within a range of 41°F to 95°F.
Network Throughput and Latency
Network performance is just as critical. Use Bytes Total/sec to evaluate network adapter utilization. For example, a 1-Gigabit network card has a maximum theoretical throughput of 125 MB/sec. Ideally, network utilization should stay below 50%; sustained levels above 80% signal potential issues.
| Resource | Metric | Healthy | Warning | Critical |
|---|---|---|---|---|
| CPU | % User Time | < 50% | 50–80% | > 80% |
| CPU | % Privileged Time | < 30% | 30–50% | > 50% |
| Memory | Available MBytes | > 10% | < 10% | < 1% or < 500 MB |
| Storage | Disk Latency | < 15 ms | > 25 ms | > 50 ms |
| Network | Interface Utilization | < 50% | 50–80% | > 80% |
To get the most out of these metrics, establish performance baselines right after hardware installation. This gives you a clear picture of what "normal" looks like for your system, making it easier to identify when performance starts to decline.
Setting Baselines and Thresholds
How to Set Baselines
A baseline is essentially a snapshot of your hardware's "normal" performance, serving as a reference point to detect changes or signs of degradation over time. Without baselines, minor performance dips might fly under the radar, leaving you unprepared to address potential issues.
To establish a solid baseline, conduct monitoring sessions over a 12–24 hour period during peak usage. Logging performance data every 15 seconds is a practical approach - it provides enough detail without overwhelming your storage capacity.
Understanding how hardware metrics align with application workloads is crucial. This helps pinpoint whether performance issues are rooted in hardware constraints or software inefficiencies. For instance, comparing SQL Server wait statistics with disk latency can reveal if sluggish queries are due to storage limitations or poorly optimized code. Tools like Windows Performance Monitor (Perfmon) and command-line utilities such as logman.exe simplify the process of setting up Data Collector Sets for long-term tracking.
Pay attention to the distinction between User Mode and Kernel Mode. If Privileged Time remains consistently high (above 50%), it may indicate problems with drivers or hardware interrupts.
Once you've established baselines, the next step is to define alert thresholds that help you identify and address issues promptly.
Defining Alert Thresholds
Setting thresholds is about finding the balance - detecting real problems without being overwhelmed by false alarms. Using a Time Over Threshold (ToT) rule ensures alerts are triggered only when metric violations are sustained. For better accuracy, require multiple data points - at least five samples - before generating an alert.
For example, you might configure an alert to trigger if CPU usage exceeds 85% for 5–10 minutes. Combining static thresholds (like 80% CPU usage) with deviations from your baseline can make alerts more precise.
"A baseline helps you identify if an ongoing issue should be considered within normal parameters or has exceeded given thresholds." – Microsoft
A three-tiered threshold system can also be effective: "Ready" at 45% CPU for planning, "Set" at 50% as an early warning, and "Go" at 60% for immediate action. For latency metrics, consider monitoring the 95th or 99th percentiles instead of averages. This approach highlights "tail latency" issues, where a small percentage of users might experience significant delays.
sbb-itb-c68f633
Best Practices for Hardware Performance Monitoring
Prioritizing Critical Alerts
One of the biggest challenges in hardware monitoring is avoiding alert fatigue. When your team is bombarded with dozens of notifications every day, there’s a real risk of overlooking the alerts that actually matter. Rob Ewaschuk, a Google SRE engineer, puts it best: "Every alert must demand prompt, focused action to avoid fatigue".
A smart approach is to focus on what users experience rather than the underlying causes. Instead of flagging every full disk or brief CPU spike, keep an eye on user-facing issues like slow response times, HTTP 500 errors, or system crashes. If users notice a problem, it’s a clear sign that action is needed.
Alerts should always be actionable. If a response can be automated - like running cleanup scripts for recurring issues - set up automation instead of paging a team member. To manage notifications effectively, categorize them into three groups:
- Pages: Require immediate action.
- Tickets: Can be addressed during business hours.
- Emails/Logs: Useful for historical analysis.
Using alert suppression logic can also cut down on noise, especially when global error rate thresholds are exceeded.
Many SRE teams rely on four key signals - latency, traffic, errors, and saturation - to maintain a high signal-to-noise ratio in their monitoring. Regularly reviewing alerts through "alert housekeeping" meetings helps identify and eliminate unnecessary notifications. Additionally, configuring monitoring tools to auto-reset when conditions normalize can streamline incident management by closing issues that resolve themselves. It’s worth noting that 91% of asset managers aim to measure SLA compliance, which is only possible if alerts are precise and actionable.
Once critical alerts are under control, the next step involves digging into long-term data to guide capacity planning and lifecycle management.
Analyzing Historical Trends
With performance baselines in place, historical data becomes a powerful tool for proactive planning. Long-term logs - like those collected over 12–24 hours with tools such as Windows Performance Monitor - help pinpoint processes that cause resource spikes. This data not only establishes performance norms but also highlights patterns that might be missed during real-time monitoring.
Looking at trends over weeks or months allows for accurate forecasting, helping you plan capacity upgrades before hitting critical limits. It also sheds light on false alarms and redundant metrics. For instance, if CPU alerts consistently trigger during scheduled backup windows, adjusting thresholds or suppressing alerts during those times can reduce unnecessary noise.
Historical data is also invaluable for lifecycle management and budgeting. Tracking equipment lifecycles, maintenance expenses, and depreciation rates ensures you’re prepared for major hardware refreshes. Considering the global IT Asset Management market is projected to surpass $2 billion by 2026, leveraging data for smarter decision-making is more important than ever.
These insights lay the groundwork for choosing the right monitoring method, which we’ll explore next.
Agent-Based vs. Agentless Monitoring
Deciding between agent-based and agentless monitoring comes down to your infrastructure and how much detail you need. Agent-based monitoring involves installing software on each endpoint, offering detailed insights into hardware health, such as CPU temperature, RAM usage, and disk SMART data. On the other hand, agentless monitoring uses existing protocols like SNMP, WMI, or the Redfish API to gather data without requiring local installations.
Here’s a quick comparison:
| Feature | Agent-Based Monitoring | Agentless Monitoring |
|---|---|---|
| Installation | Requires software on every device | No software; uses existing protocols |
| Data Depth | High (detailed internal metrics) | Moderate (limited to protocol data) |
| Resource Usage | Consumes host CPU and RAM | Minimal impact on device resources |
| Maintenance | Needs agent updates and checks | Involves configuring protocols (SNMP/WMI) |
| Best For | Critical servers, deep diagnostics | Legacy systems, networking gear, IoT devices |
Agent-based monitoring is ideal for critical systems where detailed metrics and automated responses are essential. Meanwhile, agentless monitoring is better suited for legacy hardware or lightweight devices that can’t handle the extra load. Many platforms now offer hybrid options, combining agents for primary systems with protocols like SNMP for peripheral devices. Whichever method you choose, don’t forget to monitor the health of your monitoring setup itself - inactive agents are a common reason for missing critical hardware data.
Advanced Monitoring Strategies
Alert Management and Automation
DevOps teams face an overwhelming number of alerts - over 2,000 per week on average - but only about 3% of these actually require immediate action. This flood of notifications can lead to missed critical issues, which is a costly problem when system outages average $5,600 per minute, or over $300,000 per hour.
Automation tools help cut through the noise by adding context to alerts. They connect alerts to configuration items, ownership details, impacted services, and remediation steps, enabling faster and more informed responses. AI and machine learning take this further by grouping related alerts from networks, hardware, and applications into a single incident, reducing alert volume by up to 85%.
Automated remediation is another game-changer. It can restart services, scale resources, or run diagnostic scripts as soon as thresholds are breached. Machine learning also predicts potential failures, such as disk issues flagged by SMART status data, allowing teams to address problems before they escalate.
"SLO-based alerting reduces alert volume by 85% while improving incident detection." – Google SRE Handbook
AI-powered anomaly detection can slash false positives by 70% compared to static thresholds. The key is setting clear criteria for what qualifies as an actionable alert. Focus on automating notifications for urgent, business-critical issues. A tiered alert system - ranging from "Warning" (dashboard notification) to "Critical" (immediate escalation) - ensures the right team gets the right information at the right time.
Integrating Monitoring with IT Asset Management
Alert optimization becomes even more effective when paired with IT asset management. This integration gives organizations better control over hardware and lifecycle tracking.
When hardware performance monitoring links to IT asset management systems, it eliminates inefficiencies like "ghost assets" - equipment you're still paying for but no longer physically have. For instance, a company managing $2 million in assets might waste $50,000 annually on these phantom items. Connecting performance data to a Configuration Management Database (CMDB) also helps pinpoint how a failing server impacts specific business services.
Tools like AdminRemix’s AssetRemix take this a step further. By combining lifecycle tracking, help desk integration, and data imports/exports, AssetRemix automates workflows. For example, if monitoring detects an idle server - one with CPU usage below 2% for 30 days - it can automatically update asset records to trigger decommissioning or reassignment. Help desk integration ensures performance alerts create tickets with full context, while historical data identifies the best time to replace hardware based on actual usage, not fixed schedules.
"If your CMDB isn't tied to Incident, Problem, and Change Management, then it's just sitting there as dead weight. The real value comes from using it to track and analyze service impacts." – Sanjay Nair, IT Operations Manager
Aligning monitoring data with billing records on a weekly basis ensures every dollar spent corresponds to an active, owned asset. Organizations can also reduce software costs by up to 30% by optimizing license use. It’s no surprise that the IT Asset Management software market is expected to grow from $7.12 billion in 2024 to $13.08 billion by 2032, driven by the demand for integrated visibility. This alignment of performance data with asset lifecycles builds on earlier monitoring strategies, offering a more comprehensive approach to IT management.
Capacity Planning and Resource Allocation
Monitoring data doesn't just help with immediate issues - it also plays a vital role in long-term planning.
By analyzing historical trends and baseline metrics, IT teams can forecast growth and reallocate unused resources. Many organizations find they have 20% to 30% more equipment than they realize, often sitting unused in storage. Tracking key metrics like RAM, disk capacity, and CPU usage helps identify when systems are nearing their limits, enabling proactive action before performance degrades. Historical data also uncovers "zombie assets" - unused hardware that can be reassigned to areas with higher demand, avoiding unnecessary purchases. For example, setting disk space alerts at 20% and 10% capacity ensures there’s time to clean up before critical failures occur.
The financial benefits are clear. Optimizing software licenses can cut costs by as much as 30%. Meanwhile, historical performance data helps predict hardware refresh cycles and budget needs more accurately. Monitoring long-term trends, such as rising requests per second, supports smarter capacity planning and SLO-based alerting.
Cloud-based IT asset management tools are increasingly popular for their scalability and real-time insights, especially in managing dynamic infrastructure. By integrating monitoring with asset management, organizations can make capacity decisions based on actual usage patterns, not guesswork.
Conclusion
Summary of Key Points
Keeping a close eye on hardware performance is the backbone of a reliable IT infrastructure. By monitoring key metrics like CPU usage, memory, disk health, and network performance, you can catch small issues before they snowball into major problems. Setting clear thresholds and using historical data to establish baselines helps IT teams define what "normal" looks like for their systems, making it easier to spot anomalies early on.
Integration takes monitoring to the next level. Combining performance monitoring with IT asset management (ITAM) eliminates inefficiencies like ghost or idle assets. Companies that embrace mature ITAM practices can save anywhere from $1 million to over $25 million. On top of that, integrating ITAM with AI-driven automation can speed up issue resolution by as much as 70%.
"Good asset management works with your monitoring tools to automatically find new devices, monitor how everything's performing, and help you figure out what needs attention in your IT infrastructure." – Sascha Neumeier
Use these strategies to fine-tune your monitoring processes and make your IT environment more efficient.
Next Steps for IT Teams
To build on these principles, IT teams should start by auditing their current monitoring setup. Verify that all core metrics are being tracked and that thresholds are correctly configured. Automated discovery tools can often uncover equipment that has gone untracked.
Ditch outdated spreadsheets in favor of unified platforms that combine performance monitoring with asset lifecycle tracking. For example, AdminRemix's AssetRemix (https://adminremix.com) offers unlimited asset management and help desk integration for $99 per month or $999 annually. This kind of centralized tool provides a single source of truth for hardware health and inventory. Automate tasks like asset discovery, set thresholds for idle equipment (e.g., CPU usage below 2% for 30 days), and reconcile inventory with billing on a weekly basis. These steps turn monitoring into a proactive strategy, ensuring every dollar invested in IT infrastructure delivers value.
FAQs
What’s the best way to set performance baselines for my hardware?
To get a solid grasp on hardware performance baselines, start by listing all the devices you plan to monitor. For each, jot down key specs like CPU, RAM, storage capacity, and network adapters. Then, pinpoint the performance metrics that matter most - things like CPU usage, memory consumption, disk activity, network throughput, and even temperature levels.
Next, gather performance data over a representative period - a full workweek is ideal. This way, you’ll capture both peak and low-usage periods, giving you a well-rounded view of how the hardware is typically used. Once you have this data, analyze it to determine what "normal" looks like. For example, if CPU usage tends to spike but stays under 85%, you might set an alert threshold slightly above that, like CPU > 85% for more than 5 minutes. Document these findings carefully, and be sure to revisit them regularly, especially after any major hardware or software updates.
To keep things efficient, consider automating your monitoring and alerts. This ensures your baseline stays relevant and helps you quickly catch and address performance hiccups. Tools like AssetRemix can make it easier to organize and update your data, keeping everything streamlined.
What are the warning signs that my hardware might be failing?
Sometimes, your hardware gives subtle (or not-so-subtle) hints that something's not right. Here are some key signs to watch for:
- Strange noises: Clicking, grinding, or high-pitched sounds coming from your hard drives or fans can signal trouble.
- Crashes and errors: Frequent freezes, crashes, or those dreaded blue-screen errors may indicate underlying hardware issues.
- Overheating: If your device overheats or shuts down unexpectedly, it’s worth checking for hardware problems.
- Sluggish performance: A noticeable slowdown or unresponsiveness during basic tasks can be a red flag.
- Disk errors: Frequent disk errors or SMART warnings from your storage device shouldn’t be ignored.
If any of these signs pop up, don’t wait - back up your data right away and dig deeper to avoid losing important files or facing unexpected downtime.
How does combining hardware monitoring with IT asset management boost efficiency?
Integrating hardware monitoring into an IT asset management (ITAM) system gives IT teams a clear, unified picture of what the asset is, who’s using it, and how it’s performing. By connecting key performance metrics - like CPU usage, memory load, or temperature - directly to asset records, teams can pinpoint problems such as overworked devices or assets nearing their warranty expiration. Best of all, they can do this without switching between multiple tools. This not only saves time but also reduces errors and speeds up the troubleshooting process.
Since ITAM systems already store critical details like serial numbers, purchase dates, and assigned users, monitoring can trigger automated actions. For instance, if a server overheats, the system might automatically create a help desk ticket. Or, it could schedule maintenance for a device before its warranty runs out. This kind of integration eliminates manual tasks, simplifies workflows, and ensures teams stay ahead of potential issues.
On top of that, combining ITAM with monitoring tools can help manage budgets more effectively. By analyzing usage patterns, teams can identify underutilized devices and decide whether to reallocate or retire them. This approach not only reduces unnecessary expenses but also boosts ROI. Together, ITAM and monitoring make operations smoother, cut downtime, and enhance efficiency across the board.