
Key Metrics for Measuring IT Help Desk Efficiency
Want to improve your IT help desk's performance? Start by tracking the right metrics. Here’s what matters most:
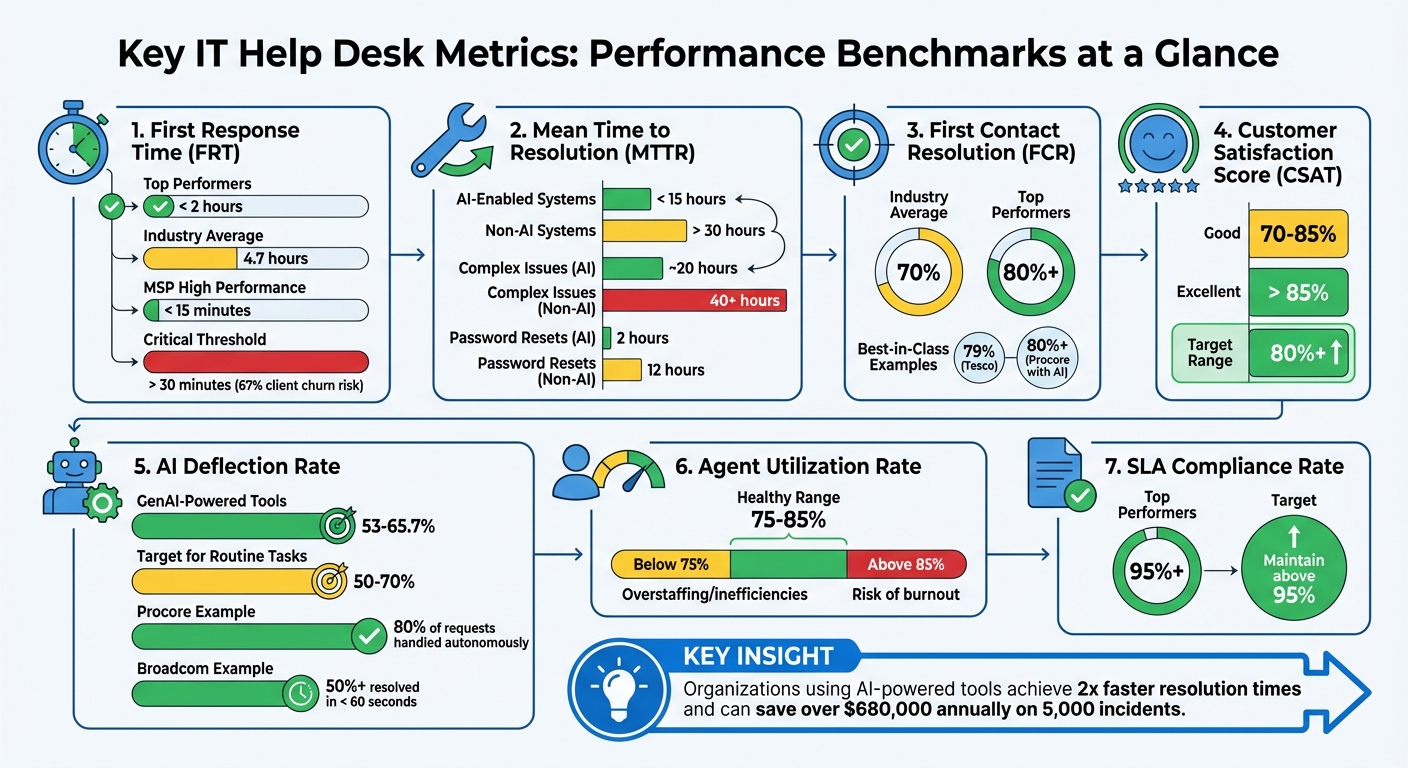
- First Response Time (FRT): Fast initial responses reduce frustration. Top teams respond in under 2 hours, while industry averages hover at 4.7 hours.
- Mean Time to Resolution (MTTR): AI-driven systems average under 15 hours, while older methods exceed 30 hours.
- First Contact Resolution (FCR): Resolving issues on the first attempt boosts satisfaction. Top performers hit 80%+ rates.
- Customer Satisfaction Score (CSAT): Scores above 85% indicate strong user experiences.
- AI Deflection Rate: Self-service tools can resolve up to 65.7% of tickets, reducing workload and costs.
- Agent Utilization Rate: Keep workloads balanced at 75–85% to avoid burnout.
- SLA Compliance Rate: Meeting deadlines ensures reliability, with top teams achieving 95%+ compliance.
The takeaway: Use data to identify gaps, allocate resources, and adopt AI tools to improve speed and quality. Metrics like FRT, MTTR, and FCR directly impact user satisfaction, productivity, and cost savings.
Key IT Help Desk Metrics: Benchmarks and Performance Standards
Essential Help Desk Metrics behind Great Customer Support - HappyFox Webinar
sbb-itb-c68f633
Core Metrics for IT Help Desk Performance
Tracking key metrics is crucial for evaluating the efficiency of IT help desks and ensuring user satisfaction.
First Response Time (FRT)
First Response Time (FRT) measures how long it takes for a human agent to respond to a ticket after it’s submitted, excluding automated replies. A quick initial response reassures users and helps reduce frustration.
The 2023 industry average for FRT is approximately 4 hours and 42 minutes, but top-performing teams often respond in under 2 hours. For Managed Service Providers (MSPs), the bar is even higher - leading MSPs aim for response times under 15 minutes. Studies show that 67% of clients may switch providers if the first response takes longer than 30 minutes. For critical issues, some MSPs set targets as low as 5 minutes.
AI-powered triage systems are becoming increasingly popular, helping reduce FRT from hours to just minutes. For example, the ACLU leveraged such systems to improve response times. Justin Birdsong, Associate Director of Enterprise Database Systems at ACLU, noted:
"We're seeing improvements in agent performance, and end users are seeing a quick turnaround time. They submit a ticket, and within the hour, their issue is resolved."
When setting FRT goals, it’s useful to prioritize based on ticket type. For instance, password resets should be addressed faster than hardware provisioning requests. Analyzing FRT by channel and time of day can uncover staffing issues, but speed shouldn’t come at the expense of quality - a rushed response can be as harmful as a delayed one.
| Performance Category | FRT Benchmark |
|---|---|
| Top Performers | < 2 hours |
| Industry Average | 4.7 hours |
| MSP High Performance | < 15 minutes |
| Critical Churn Threshold | > 30 minutes |
Average Handle Time (AHT)
Average Handle Time (AHT) measures the total time spent resolving a ticket, including all interactions and follow-ups. While a lower AHT can indicate efficiency, it’s important to ensure that quality isn’t sacrificed in the process. Rushing through tickets to reduce AHT can lead to unresolved issues and ticket reopenings. Balancing AHT with metrics like resolution quality ensures both speed and user satisfaction.
AHT focuses on efficiency, while First Contact Resolution (FCR) highlights the quality of support by showing how often issues are resolved during the first interaction.
First Contact Resolution (FCR)
First Contact Resolution (FCR) tracks the percentage of tickets resolved on the first attempt. High FCR rates reduce user frustration and prevent ticket backlogs. The industry average for FCR is around 70%, with top-performing help desks achieving 80% or more.
In 2024, Tesco achieved a 79% one-touch resolution rate for its 460,000 employees across nine countries using Zendesk, significantly reducing reopened tickets. AI tools also play a role in boosting FCR. Procore’s AI-powered copilot, "Bolt", handles over 80% of IT requests through Slack, achieving a 98% employee satisfaction rate. Similarly, Broadcom’s LLM-powered platform resolves over 50% of IT issues in under 60 seconds by analyzing open-ended queries and providing instant solutions.
It’s important to set FCR targets based on ticket complexity, as some issues may naturally require multiple interactions. Monitoring reopen rates alongside FCR ensures that a focus on speed doesn’t compromise resolution quality. Automating routine tasks, like password resets, can help achieve near-perfect resolution rates on the first contact.
| Metric | Industry Average/Standard | Top Performer/World-Class |
|---|---|---|
| First Contact Resolution (FCR) | 70% | 80%+ |
| First Response Time (FRT) | 4.7 hours | < 2 hours |
Customer Satisfaction Score (CSAT)
Customer Satisfaction Score (CSAT) is typically derived from post-resolution surveys. Scores between 70% and 85% are considered good, while anything above 85% is excellent. Positive customer experiences are directly linked to higher retention rates.
To get accurate insights, CSAT surveys should be brief and sent immediately after ticket resolution. Many organizations now complement surveys with AI-driven sentiment analysis to better understand user satisfaction. Tracking trends in CSAT over time helps identify areas for improvement and align services with user needs.
Resolution Time
Resolution Time, or Mean Time to Resolution (MTTR), measures the total time from when an issue is reported to when it’s fully resolved. Long resolution times can indicate inefficiencies like unclear workflows or poor documentation, which can affect SLA compliance and overall service quality.
There’s a clear gap between companies using AI and those relying on traditional systems. Non-AI companies average over 30 hours for MTTR, while AI-enabled organizations typically resolve issues in under 15 hours. For complex issues, non-AI environments may take over 40 hours compared to around 20 hours for AI-driven systems. Routine tasks like password resets take about 12 hours in traditional setups but just 2 hours with AI.
For example, the ACLU saw a 10.5% boost in CSAT scores after expanding its use of Zendesk, often resolving tickets within an hour. Similarly, in 2023, loanDepot reduced its approval process from nearly a week to under 5 minutes using conversational AI on Microsoft Teams.
Setting resolution time goals based on ticket type and severity ensures a balanced approach. Monitoring reopen rates alongside resolution times helps maintain quality even as speed improves. Updating knowledge base articles for frequently delayed ticket types can also drive faster resolutions, building trust in IT support.
| Metric | Non-AI Companies | AI-Enabled Leaders | | --- | --- | | Mean Time to Resolution (MTTR) | >30 hours | <15 hours | | High-Touch Issue Resolution | 40+ hours | ~20 hours | | Access Restoration Time | 12 hours | 2 hours |
Team Productivity Metrics
Analyzing team-level metrics offers a broader view of help desk performance, going beyond individual ticket data. These indicators provide insight into whether your team is maintaining a sustainable pace or facing potential burnout.
Agent Utilization Rate
The Agent Utilization Rate tracks how much of an agent's shift is dedicated to support tasks. The formula is simple:
(Time spent on support tasks ÷ Total available work time) × 100.
A healthy range falls between 75% and 85%. Falling below this range can point to overstaffing or inefficiencies, while consistently exceeding it - especially into the high eighties or nineties - may indicate an overworked team. As Radu, Head of Digital Transformation at BlueTweak, highlights:
"Sustained values in the high eighties or nineties suggest a team running hot. Short peaks happen; long strain predicts attrition."
To accurately measure utilization, teams typically rely on system-logged hours tied to tickets or manual timesheets. To prevent burnout, consider scheduling focused work intervals for specialists and maintaining a small overflow pool to manage surges.
Ticket Volume and Backlog
Tracking ticket volume - the total number of tickets over a specific period - helps identify demand trends and plan resources effectively. On average, help desks handle between 1,000 and 1,500 tickets monthly. Breaking this data down by channel (e.g., email, chat, or portal) and ticket type (e.g., password resets or hardware issues) or IT asset management needs can uncover areas of high demand.
The backlog metric, calculated as (Open tickets at the start + New tickets) − Resolved tickets, acts as a critical early warning system. A growing backlog often signals high demand or inefficiencies, such as unclear ownership or incomplete ticket details. As EZO AssetSonar puts it:
"A growing backlog is a red flag. It indicates that issues are arriving faster than they're being resolved. If you want to forecast staffing needs, start here."
Breaking down the backlog by category instead of relying on a total count can help identify specific bottlenecks. Regular "unblock huddles" focused on aging tickets can also reduce escalations and improve throughput.
| Metric | Calculation | Key Insight |
|---|---|---|
| Agent Utilization | (Time on support tasks / Total shift time) × 100 | Balancing productivity and burnout |
| Ticket Backlog | (Open tickets at start + New tickets) − Resolved tickets | Identifying process bottlenecks |
| SLA Compliance | (Tickets resolved within SLA / Total tickets) × 100 | Ensuring service reliability |
SLA Compliance Rate
The SLA Compliance Rate measures how well the team meets agreed response and resolution deadlines, reflecting overall service reliability. Top-performing teams often achieve compliance rates of 95% or higher. This metric is vital for maintaining user trust and service consistency.
To keep SLA compliance high, consider implementing live breach alerts in your ticket queue instead of relying on after-the-fact reporting. Aligning internal Operational Level Agreements (OLAs) with external SLAs is also crucial. For instance, if your SLA sets a 4-hour resolution target, make sure internal vendors can realistically meet their response times. Automating escalation rules for tickets nearing their SLA deadline can further improve compliance. Additionally, protecting "deep work" periods for L2 and L3 agents ensures they can handle complex tasks without constant interruptions from L1 queues.
Technology-Driven Efficiency Metrics
In today’s IT help desk operations, technology-driven metrics are reshaping how efficiency is measured. With the rise of AI and automation, these metrics highlight how technology speeds up resolution times and reduces manual tasks. They provide a clear picture of the return on investment from automation and pinpoint areas where it adds the most value. These measures work alongside traditional performance indicators to show how automation drives operational improvements.
AI Deflection Rate
The AI Deflection Rate tracks the percentage of support requests resolved through self-service tools - like AI chatbots, virtual agents, and knowledge bases - without needing human involvement. By 2026, organizations leveraging GenAI-powered self-service tools reported deflection rates between 53% and 65.7%. Leading IT teams aim for deflection rates of 50% to 70% for routine tasks such as password resets and access requests.
Higher deflection rates translate into lower costs and faster service delivery. For example, a team managing 5,000 incidents annually could save over $680,000 in efficiency value by implementing GenAI solutions.
Real-world examples bring these benefits to life. In 2023, Procore introduced an AI-powered copilot named "Bolt" via Slack to handle IT requests. This system now handles over 80% of requests autonomously - covering tasks like password resets and account unlocks - while maintaining a 98% employee satisfaction rate. Similarly, Broadcom implemented an LLM-powered platform that resolves more than 50% of IT issues in under 60 seconds by analyzing open-ended queries and delivering instant troubleshooting solutions.
Lauren Okruch, Senior Manager at SolarWinds, emphasizes the role of AI in enhancing human effort:
GenAI acted as a force multiplier, not a magic solution. The most successful IT teams aren't using AI to replace human effort; they're using it to enhance it.
Impact of IT Asset Management Tools
Integrated IT Asset Management (ITAM) tools are another game-changer, linking asset data directly to support tickets. This integration gives technicians instant access to critical insights, eliminating the need for manual data searches. When paired with a Configuration Management Database (CMDB), ITAM tools provide the visibility needed to diagnose and resolve issues more quickly. Organizations using these tools have identified savings of $53.6 million just from unused licenses.
Platforms like AdminRemix's AssetRemix demonstrate the power of combining IT asset management with help desk support. By giving technicians immediate access to device specs, software licenses, and lifecycle data, AssetRemix reduces the time spent toggling between systems. This streamlined approach not only speeds up ticket resolution but also improves SLA compliance, especially for hardware-related issues where asset details are crucial.
Automation takes this even further. In 2024, loanDepot implemented conversational AI to handle approval requests through Microsoft Teams. This reduced approval times for access and provisioning tickets from nearly a week to under 5 minutes. These advancements are helping IT help desks shift from being reactive cost centers to proactive business partners that deliver measurable results.
Key Takeaways
Measuring IT help desk efficiency hinges on tracking the right metrics. First Contact Resolution (FCR) stands out as a key indicator - boosting FCR not only cuts costs but can lead to notable annual savings for mid-sized operations. When paired with metrics like Mean Time to Resolution (MTTR) and First Response Time (FRT), organizations gain a well-rounded view of team responsiveness. Notably, teams using AI-powered tools achieve much faster resolution times compared to those relying on older systems.
Metrics like Customer Satisfaction (CSAT) and SLA compliance ensure quick responses don’t compromise service quality. A CSAT score of 80% or higher is a good benchmark, while tracking tickets close to breaching SLA targets helps identify bottlenecks. Monitoring the Agent Utilization Rate - ideally between 75–85% - and balancing ticket volumes also prevents overloading staff and reduces burnout. These insights naturally connect to how emerging technologies are reshaping support operations.
Tech-driven metrics, such as AI deflection rates and integrated IT asset management, are transforming help desk workflows. Self-service options deflect routine requests, freeing agents to handle more complex issues. For example, tools like AdminRemix's AssetRemix integrate IT asset management with help desk systems, giving technicians instant access to device specs and software license details. This streamlines resolution times and supports SLA compliance.
The key is to act on these metrics. As Molly Small from Fixify puts it:
Without metrics, you're flying blind (or driving without a GPS).
Schedule regular reviews of your metrics, set SLA priorities based on ticket types, and use automation to minimize manual errors. Organizations that consistently refine their processes based on these metrics see real gains in both cost savings and user satisfaction.
FAQs
How can AI tools help improve response times for IT help desks?
AI tools, particularly generative AI, can significantly speed up IT help desk operations by taking over repetitive tasks and delivering smart support solutions. For example, AI can create ticket summaries, recommend responses, and suggest troubleshooting steps. This allows IT agents to resolve issues faster and focus on more complex problems.
Self-service options powered by AI also play a big role. These tools let users handle common issues on their own, cutting down the need for direct assistance. The result? Faster initial response times and better management of high ticket volumes without sacrificing service quality.
By integrating AI tools, IT teams can streamline workflows, boost productivity, and enhance user satisfaction - all while keeping up with growing demands.
How does a high First Contact Resolution (FCR) rate enhance user satisfaction?
A high First Contact Resolution (FCR) rate plays a major role in boosting user satisfaction. When issues are resolved during the first interaction, it eliminates unnecessary delays, eases frustration, and ensures a smoother experience for users.
Quickly addressing problems not only builds trust but also strengthens the bond between IT teams and their users. It enhances productivity and reflects an IT support system that prioritizes efficiency and user needs. High FCR rates are a clear sign of a well-functioning, user-centered help desk.
Why is it important to monitor Agent Utilization Rate to prevent burnout?
Monitoring the Agent Utilization Rate plays a crucial role in striking the right balance between productivity and employee well-being. Overworked agents are more likely to experience burnout, decreased job satisfaction, and a dip in performance. By keeping tabs on this metric, managers can spot when workloads become overwhelming and make adjustments to distribute tasks more evenly.
This approach doesn’t just boost efficiency - it also creates a healthier, more sustainable work environment. When workloads are manageable, agents are more likely to stay motivated and engaged, which benefits the team in the long run. Paying attention to utilization rates is essential for building a strong, productive IT help desk team.