
Improving IT Resource Allocation with Metrics
IT resource allocation can make or break efficiency and budgets. The secret? Metrics. By tracking the right data, IT teams can spot inefficiencies, balance workloads, and cut waste. Here's what you need to know:
- Staff Utilization: Keep workloads balanced - aim for 75–85% utilization. Over 90% risks burnout; under 70% signals inefficiencies.
- License Use: Ensure at least 80% of software licenses are active to avoid paying for unused tools.
- Device Utilization: Check for idle devices by monitoring usage and activity (e.g., last-seen dates).
- Capacity Gaps: Compare workload demand with team capacity to avoid over- or under-staffing.
- Bench Time: Unused hours should stay under 10%, while overtime should remain below 5%.
Metrics like these reveal hidden problems and guide better decisions. Tools like CMDBs and automated tracking simplify data collection, while weekly reviews ensure adjustments happen in real-time. By focusing on data, IT leaders can keep teams productive, budgets lean, and resources optimized.
Understanding IT Asset Management Metrics: Key Performance Indicators for Effective Management
sbb-itb-c68f633
IT Resource Allocation Challenges Metrics Can Reveal
IT allocation problems often operate under the radar. They quietly drain budgets, slow teams down, and create bottlenecks that can be tough to diagnose. The right metrics act like a magnifying glass - highlighting hidden inefficiencies so you can tackle the actual problem instead of guessing. Below, we explore common challenges and the metrics that can shine a light on them.
Poor Asset and License Visibility
Without a clear, up-to-date IT asset management strategy, IT teams are left making decisions based on incomplete data. This can lead to scenarios like unused laptops gathering dust while new ones are unnecessarily purchased or duplicate software licenses being bought because existing ones aren’t tracked. Two critical metrics can help address this:
- Asset Inventory Completeness: Tracks the percentage of assets fully documented, including their status and location.
- License Utilization Rate: Measures active users against total purchased licenses. A license utilization rate below 80% indicates you're paying for unused seats, wasting money.
Uneven IT Staff Workloads
On the surface, overall team utilization might look fine - usually between 75% and 85%. However, a deeper dive can reveal imbalances where some team members are overwhelmed while others have extra capacity. This imbalance can lead to burnout and inefficiencies. Tracking individual utilization rates ensures workloads are distributed more evenly across the team.
Idle and Underused Devices
Rapid growth or downsizing often leaves organizations with hardware waste. Devices get assigned and forgotten, creating situations where one department is short on hardware while another has idle assets collecting dust. Two key metrics to monitor here:
- Device Utilization Rate: Tracks how actively devices are being used.
- Last-Seen Age: Measures how long it’s been since a device was last active on the network. Devices inactive for more than 14 days should be flagged, as they not only waste resources but also miss critical security updates.
Budget Waste from Unused Software Licenses
SaaS sprawl is a major source of budget waste. For instance, collaboration software suites alone account for about 25% of waste, and a surprising 42% of former employees retain access to at least one corporate application. To combat this, monitor:
- License Utilization Rate: As Chris Shuptrine of Torii explains, “Anything below 0.8 [License Utilization Rate] means you're paying for empty chairs.”
- App Redundancy Ratio: This measures overlapping apps divided by total apps. An enterprise average of 0.37 exceeds the recommended threshold of 0.25.
Key IT Resource Utilization Metrics to Track
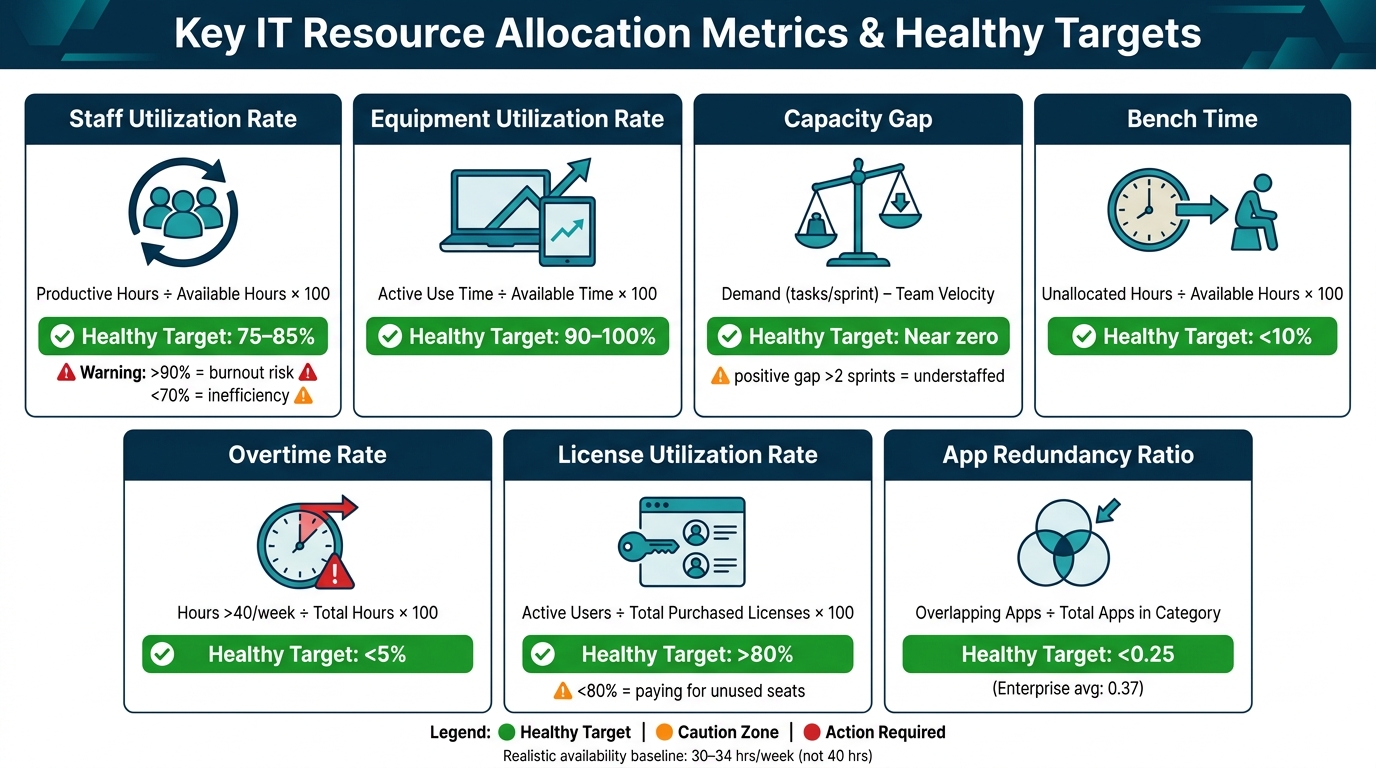
Key IT Resource Allocation Metrics & Healthy Targets
Once you've identified resource imbalances, tracking the right metrics becomes essential. These measurements help pinpoint where resources are being effectively used - or wasted.
Utilization Rate for Staff and Equipment
The utilization rate serves as a cornerstone metric for IT teams. For staff, it's calculated as (Productive Hours ÷ Available Hours) × 100. However, accurately defining "available hours" is critical.
"The biggest trap in resource management is assuming that a 40-hour work week equals 40 hours of availability. It does not." - Ben Brigden, Content Marketing Manager, Teamwork.com
In reality, engineers spend 15–25% of their time on activities like code reviews, learning, or dealing with unplanned incidents. For a 40-hour work week, a more realistic baseline is 30–34 hours.
The ideal range for IT staff utilization is 75–85%. Pushing past 90% consistently can lead to burnout and leave no room for addressing technical debt or unexpected issues. On the flip side, rates below 70% may indicate overstaffing or inefficiencies.
For shared equipment, the bar is higher. Optimal utilization for devices and hardware is 90–100%. Anything significantly lower suggests underused assets that could be reallocated or retired.
Once utilization rates are clear, comparing capacity with demand helps identify where adjustments are needed.
Capacity vs. Demand Metrics
The Capacity Gap metric - calculated as Demand (story points or tasks per sprint) − Supply (team velocity) - highlights whether your team is consistently understaffed. A positive gap for more than two sprints signals a chronic mismatch between workload and team capacity. This insight is invaluable for fine-tuning resource allocation before problems escalate.
Bench Time - defined as (Unallocated Hours ÷ Available Hours) - should remain under 10%. Higher percentages indicate idle staff, which translates into wasted costs. Similarly, Overtime Rate - calculated as (Hours over 40/week ÷ Total Hours) - should stay below 5%. Exceeding this threshold often points to under-resourcing and can lead to retention challenges.
Another key metric is context switching, or the number of concurrent projects assigned to an individual. The more projects someone juggles, the slower their progress on each one. High context switching often goes unnoticed in standard reports but significantly impacts productivity.
License Utilization Metrics
Software licenses are one of the most manageable areas of IT spending - if you're tracking the right metrics.
Cost per Active User takes your total contract cost and divides it by the number of unique active users during a set period (e.g., 30 days). This metric provides a tangible dollar figure to evaluate whether licenses are worth renewing or canceling. The App Redundancy Ratio - calculated as (Overlapping Apps ÷ Total Apps in a Category) - helps identify duplicate tools. Aim for a ratio below 0.25, compared to the enterprise average of 0.37.
"License costs balloon when no one verifies who still logs in." - Chris Shuptrine, Torii
The table below summarizes these key metrics and their healthy targets:
| Metric | Formula | Healthy Target |
|---|---|---|
| Staff Utilization Rate | Productive Hours ÷ Available Hours | 75–85% |
| Equipment Utilization Rate | Active Use Time ÷ Available Time | 90–100% |
| Capacity Gap | Demand − Team Velocity (sprints) | Near zero; positive > 2 sprints = understaffed |
| Bench Time | Unallocated Hours ÷ Available Hours | < 10% |
| Overtime Rate | Hours > 40/week ÷ Total Hours | < 5% |
| License Utilization Rate | Active Users ÷ Total Purchased Licenses | > 80% |
| App Redundancy Ratio | Overlapping Apps ÷ Total Apps in Category | < 0.25 |
Building a Metrics-Driven IT Allocation Process
Metrics are only useful when they actively guide IT resource decisions.
Setting Goals and Thresholds
To effectively evaluate IT resource allocation, use clear benchmarks like 75–85% staff utilization, bench time under 10%, and overtime below 5%. These targets are grounded in realistic productivity expectations. For instance, in a standard 40-hour workweek, subtract 12 hours for non-productive tasks, leaving about 28 productive hours per engineer.
Don’t overlook attrition. The IT sector typically experiences an annual turnover rate of 13–15%. Ignoring headcount changes in capacity planning will lead to overly optimistic delivery estimates. With well-defined goals, integrate your data for a more accurate and actionable view.
Centralizing Data Collection
Scattered data can derail resource management. Too often, hardware inventories sit in one spreadsheet, software licenses in another, and project workloads are buried in a poorly maintained management tool. The solution? Consolidation.
"A systematic approach to IT resource management helps organizations get a complete picture of their infrastructure, optimize their spending, and lower their operational risks." - Luiz Telles, Editor, SimpleOne
A Configuration Management Database (CMDB) can act as a central hub by tying asset data to business service needs in one place. To keep this data current, automated tools like network scanners and monitoring agents are essential, reducing reliance on manual updates. For example, AssetRemix from AdminRemix simplifies IT asset management by automating inventory tracking, ensuring records stay accurate without extra administrative burden. A unified dashboard not only simplifies data collection but also makes it easier to adjust resource allocations on the fly.
Monitoring and Adjusting Allocation
Resource allocation isn’t a one-and-done task - it’s an ongoing process. Instead of relying on quarterly planning cycles, adopt a weekly review cadence. Each week, compare planned efforts to actual hours logged. Identify team members nearing 90% utilization and check for signs of rising bench time beyond the 10% threshold.
When project scope changes, revisit resource allocations immediately. Proactive adjustments are far less costly than discovering bottlenecks mid-sprint. As Ben Brigden from Teamwork.com explains:
"If the work changes, the plan changes. If project stakeholders refuse a plan change, call it what it is - a risk decision."
To improve over time, log the assumptions behind each resource estimate during reviews. This practice will reveal patterns in forecasting errors, sharpening your estimates for future planning.
Using Metrics to Manage Google Workspace and Device Fleets

Managing Google Workspace environments comes with its own set of challenges. From expanding device fleets to unused licenses and meeting tools, these inefficiencies can drain IT budgets. Metrics offer a way to uncover these issues and guide IT teams toward smarter management strategies. Let’s dive into key metrics and tools to help streamline Google Workspace resources.
Managing Chromebook Fleets
For IT teams overseeing large Chromebook deployments, two metrics stand out: Auto Update Expiration (AUE) dates and OS version distribution.
- AUE dates: These help IT teams track when devices are nearing the end of their support lifecycle. Proactively replacing outdated hardware ensures security gaps don’t arise.
- OS version distribution: This metric, segmented by organizational units, identifies devices that are behind on updates - a critical security risk for both schools and businesses.
Keeping device records updated, moving units between organizational units (OUs), or deprovisioning lost devices can be incredibly time-consuming when done manually. Tools like Chromebook Getter from AdminRemix simplify these tasks. This tool allows IT admins to manage Chromebook metadata in bulk via Google Sheets, making it easier to handle AUE reporting, bulk OU moves, and activity history searches. Over 350 premium G-Suite administrators rely on it to streamline fleet management.
"This is the best tool to help you manage Chromebooks all in one place. Their knowledge & response time is spot on!" - Lorene Cowan, Technology Office Manager
Now, let’s shift to tackling license management in Google Workspace.
Auditing Google Workspace Licenses
License waste is a common issue in collaboration platforms like Google Workspace, with an average of 25% of licenses going unused. The key metric here is the License Utilization Rate, which measures the ratio of active users to the total number of purchased licenses. To minimize waste, aim for a utilization rate of at least 80%.
Another common problem is inactive accounts left behind by former employees, which not only wastes money but also creates security risks. Regular audits - ideally performed quarterly - can help identify these accounts. Pairing audits with automated deprovisioning through an HRIS system ensures that both costs and risks are addressed. Tools like User Getter from AdminRemix make this process more efficient by enabling bulk management of user metadata, helping IT teams quickly identify and deactivate stale accounts.
Improving Google Meet Efficiency
Google Meet generates a wealth of metrics, but many of these are underutilized. Metrics like feedback scores, client CPU usage, packet loss, and round trip time (RTT) reveal specific issues, whether it’s a network bottleneck, an underpowered device, or bandwidth challenges during large meetings. The Google Meet Quality Tool (MQT) stores this data for 30 days, giving IT teams a short but valuable window to investigate recurring issues.
Beyond troubleshooting, monitoring room occupancy is another way to improve efficiency. Comparing room occupancy data with calendar bookings can expose "ghost" meetings - reserved rooms that go unused. Identifying these patterns helps optimize space usage and reduce scheduling conflicts. The Meet Enhancement Suite from AdminRemix adds over 40 features to Google Meet, such as auto-record, mute all, and remove all participants, cutting down on meeting-related support requests.
Conclusion: Using Metrics and Tools to Improve IT Efficiency
Metrics turn IT resource management into a structured, data-focused process, spotlighting essential figures like utilization rates, device health, and staff workloads. Luiz Telles, Editor at SimpleOne, explains it well:
"A systematic approach to IT resource management helps organizations get a complete picture of their infrastructure, optimize their spending, and lower their operational risks."
One key advantage of a metrics-driven strategy is the ability to centralize critical data, such as asset inventories, license counts, and device records. For example, spotting issues early - like utilization rates exceeding 90% - can prevent bigger problems down the line. Tools like AdminRemix simplify this process by integrating IT asset management, Chromebook fleet tracking, Google Workspace user data, and meeting analytics, eliminating the need for tedious manual spreadsheet updates.
The ultimate goal is ongoing improvement. By comparing actual performance against planned outcomes, adjusting thresholds, and addressing issues weekly, teams can prevent minor setbacks from escalating. This approach is especially important given that poor resource allocation is responsible for 23% of missed project deadlines - a problem that consistent metric reviews can help address.
Focus on the most critical metrics, centralize your data collection, and treat resource management as a continuous process rather than a once-a-year task.
FAQs
Which metrics should we track first?
Tracking the right metrics is essential to align IT operations with your organization's goals. Focus on key indicators like incident response time, which measures how quickly issues are addressed, and equipment utilization rate, which highlights how effectively resources are being used. Keeping an eye on license compliance ensures your organization avoids unnecessary risks and remains within legal boundaries.
Additionally, monitor system uptime to maintain service reliability, SLA compliance to meet contractual obligations, and resolution time to gauge the efficiency of your support team. By concentrating on these metrics, you can allocate IT resources more effectively and make informed, data-driven decisions.
How do we define 'available hours' for utilization?
'Available hours' represent the total time a person or team has to focus on work after factoring in predictable overhead, support tasks, and scheduled time off. By understanding this, you can plan work that aligns with actual capacity, helping to prevent overcommitment and reduce the risk of burnout.
How can we automate asset and license tracking?
Automating asset and license tracking relies on centralized systems that sync data in real time across your network. Tools like AdminRemix AssetRemix can automatically scan your network, identify assets, and keep records up to date. With features like scheduled audits, barcode scanning, and compliance alerts, you can easily monitor usage, spot unused licenses, and handle renewals without hassle. These tools not only cut down on manual errors but also save time and improve overall efficiency.