
How to Track Software Usage in Google Workspace
Tracking software usage in Google Workspace is critical for managing licenses, identifying security risks, and improving productivity. By monitoring app usage, login patterns, and third-party integrations, IT admins can make informed decisions to optimize costs and ensure compliance. Here’s what you need to know:
- Key Tools: Use the Admin Console, Reports API, and audit logs for detailed insights into app adoption, user activity, and security events.
- License Management: Monitor active, suspended, or blocked accounts to allocate resources efficiently and avoid unnecessary costs.
- Security Monitoring: Audit OAuth token activity to track third-party app access and detect potential vulnerabilities.
- Advanced Tracking: Export data to BigQuery for custom analysis and long-term storage, or integrate with tools like AdminRemix for deeper insights.
- Subscription Tiers: Advanced features like the Security Investigation Tool and automated activity rules are available only in premium editions.
Regular reporting (weekly, monthly, quarterly) ensures you stay on top of security, app usage, and storage trends. Combining Google Workspace’s tools with third-party integrations can simplify tracking and improve decision-making.
Google Workspace Analytics Understanding usage, engagement, and security
Prerequisites and Access Requirements
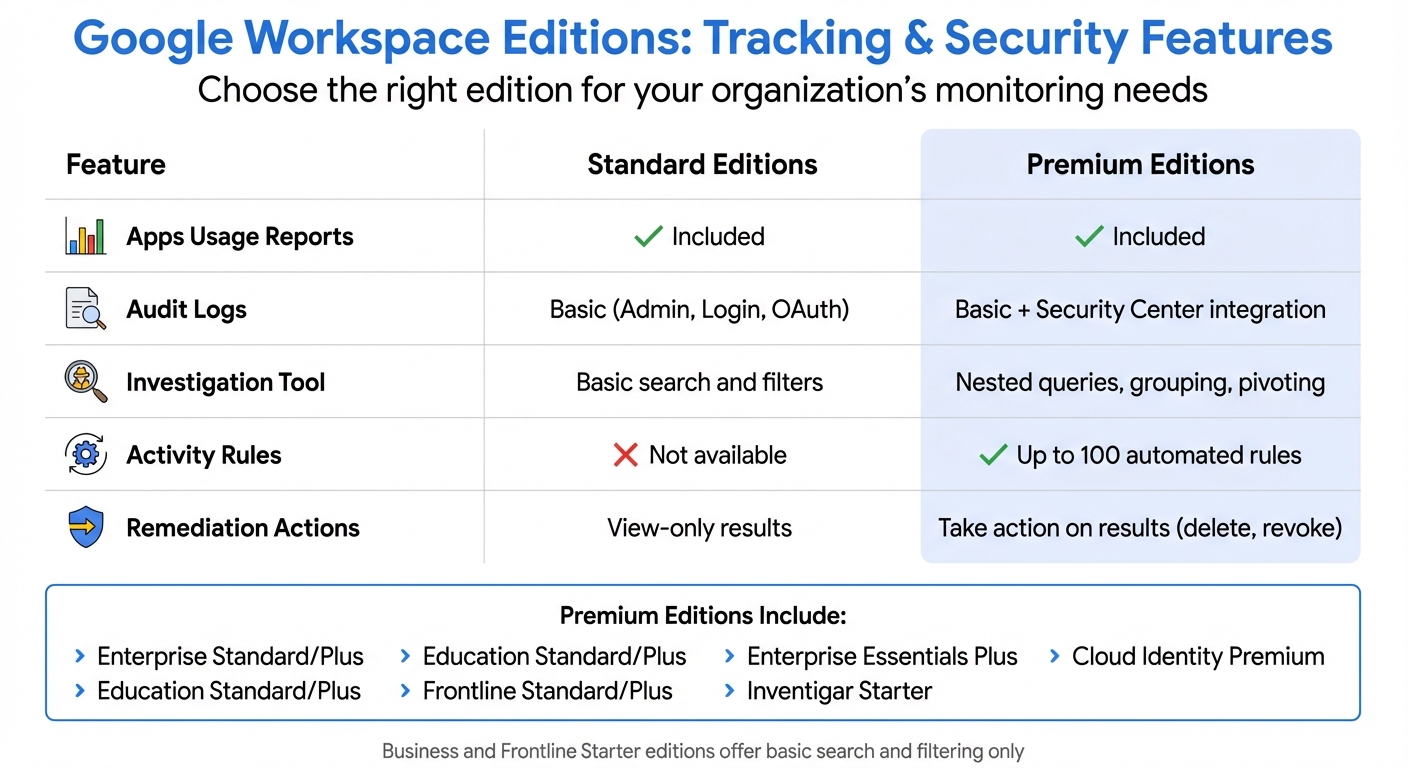
Google Workspace Editions Feature Comparison for Software Usage Tracking
To effectively track software usage in Google Workspace, you need to ensure that your admin permissions and organizational settings are correctly configured. Without the right setup, access to usage reports and audit logs will be restricted.
Required Admin Roles
To access the "User reports: Apps usage" section in the Google Admin console, you must have the Reports Administrator privilege. Standard admin accounts lack the necessary permissions to view usage reports. If your goal is to access audit logs through Google Cloud Logging, you’ll also need to configure Identity and Access Management (IAM) roles and permissions at the organization level. For managing integrations like Apps Script projects, admins must have delete permissions on the associated Google Cloud project. Additionally, retrieving data from the Reports API requires setting up OAuth 2.0 tokens.
Once the appropriate roles are in place, ensure your organizational settings are adjusted to enable log sharing.
Google Workspace Editions and Features
All Google Workspace editions, including Cloud Identity and Cloud Identity Premium, offer basic audit logs and usage reports. However, the availability of advanced tracking features depends on your subscription tier. For instance, the Security Investigation Tool - which allows nested queries, grouping, and taking action on search results (like revoking access or deleting files) - is exclusive to premium editions such as Enterprise Standard/Plus, Education Standard/Plus, Frontline Standard/Plus, Enterprise Essentials Plus, and Cloud Identity Premium. These premium editions also provide support for up to 100 automated activity rules and custom Security Dashboard charts. On the other hand, Business or Frontline Starter editions only offer basic search and filtering capabilities, without options to save investigations or automate monitoring tasks.
| Feature | Standard Editions | Premium Editions |
|---|---|---|
| Apps Usage Reports | Included | Included |
| Audit Logs | Basic (Admin, Login, OAuth) | Basic + Security Center integration |
| Investigation Tool | Basic search and filters | Nested queries, grouping, pivoting |
| Activity Rules | Not available | Up to 100 automated rules |
| Remediation Actions | View-only results | Take action on results (delete, revoke) |
Make sure to align your subscription tier with your organization's tracking and security needs.
Organizational Setup and Policies
To access audit logs, you must enable "Google Workspace data sharing with Google Cloud". By default, this setting is disabled, and you’ll need to activate it before logs become visible in Cloud Logging. Additionally, you should enable specific log types - such as Admin, Login, and OAuth Token audits - and configure aggregated sinks to direct logs to BigQuery, Cloud Storage, or Pub/Sub for advanced analytics. For long-term data storage, set up custom retention policies. If you need to filter reports based on specific Google Groups, add those groups to a "filtering groups allowlist" in your reporting settings. Lastly, ensure that services like Apps Script are enabled for your organization or specific organizational units to allow activity tracking.
With these settings in place, your organization will be ready for seamless log integration and advanced reporting.
Using the Google Workspace Admin Console for Usage Insights
The Admin Console serves as your go-to dashboard for tracking usage patterns, monitoring security events, and reviewing login activity across your organization. With the right permissions, you can access detailed reports to better understand how your team interacts with Google Workspace services.
Accessing and Analyzing Reports
To dive into usage data, log in with your administrator account and head to Menu > Reporting > Reports. From there, you can choose between User Reports for detailed individual activity or Apps Reports for broader organizational trends.
- User Reports: These focus on specific activities, such as emails sent, files created, and chat messages exchanged.
- Apps Reports: These provide high-level insights, including Gmail delivery rates, Drive sharing patterns, and active user stats for tools like Meet and Chat.
You can filter the data by organizational unit and customize the columns to spotlight metrics like "Drive - last active time" or "2-Step Verification enrollment". If you need to analyze the data further, export it to Google Sheets or download it as a CSV file. Keep an eye out for asterisks (*), which indicate that some data might be slightly outdated compared to other columns.
Reports are available for up to 450 days, but many key metrics in the Apps usage report only cover the last six months. It’s worth noting that these reports aren’t updated in real-time, so there may be a delay between events and when they appear in the console.
For a deeper look into user and admin activity, the next step is to review audit logs.
Reviewing Audit Logs
Audit logs provide a detailed record of user and administrator actions within your organization. To access them, go to Menu > Reporting > Audit and investigation. Here’s what you can expect:
- Admin log events: Track configuration changes and administrative actions.
- User log events: Monitor account activities like login patterns and password updates.
- OAuth log events: Keep an eye on third-party apps and websites that users have authorized to access their Google Workspace data.
For security purposes, OAuth Token activity reports are especially useful. They help you identify external apps with access to sensitive data, such as Contacts or Drive files. You can refine your searches using AND/OR operators and apply filters by organizational unit or specific Google Groups to compare activity across departments.
Organizations using premium editions like Enterprise Standard, Education Plus, or Cloud Identity Premium have access to the Security Investigation Tool. This tool provides advanced features, including nested queries, grouping results, and bulk actions on search results. Keep in mind that each export is capped at 100,000 rows.
Once you’ve reviewed the logs, it’s a good idea to configure retention settings to align with your compliance requirements.
Configuring Log Retention and Frequency
By default, Google Workspace retains login and admin activity logs for 180 days. If your organization requires a longer retention period, you can route audit logs to Google Cloud services like BigQuery or Cloud Storage. This setup allows you to establish customized retention policies that meet your specific compliance needs.
To stay ahead of potential security issues, enable admin email alerts for critical events, such as suspicious login attempts or changes to service settings. Premium editions also allow you to set up to 100 automated activity rules for ongoing security monitoring.
These tools and settings provide a robust framework for maintaining oversight and ensuring the security of your Google Workspace environment.
Exporting and Analyzing Workspace Data with Google Cloud
While built-in reporting tools are useful, exporting Google Workspace data to Google Cloud takes tracking and analysis to the next level. By moving data to the cloud, you can run advanced queries, access extended historical records, and create custom visualizations tailored to your needs.
Exporting Logs to BigQuery
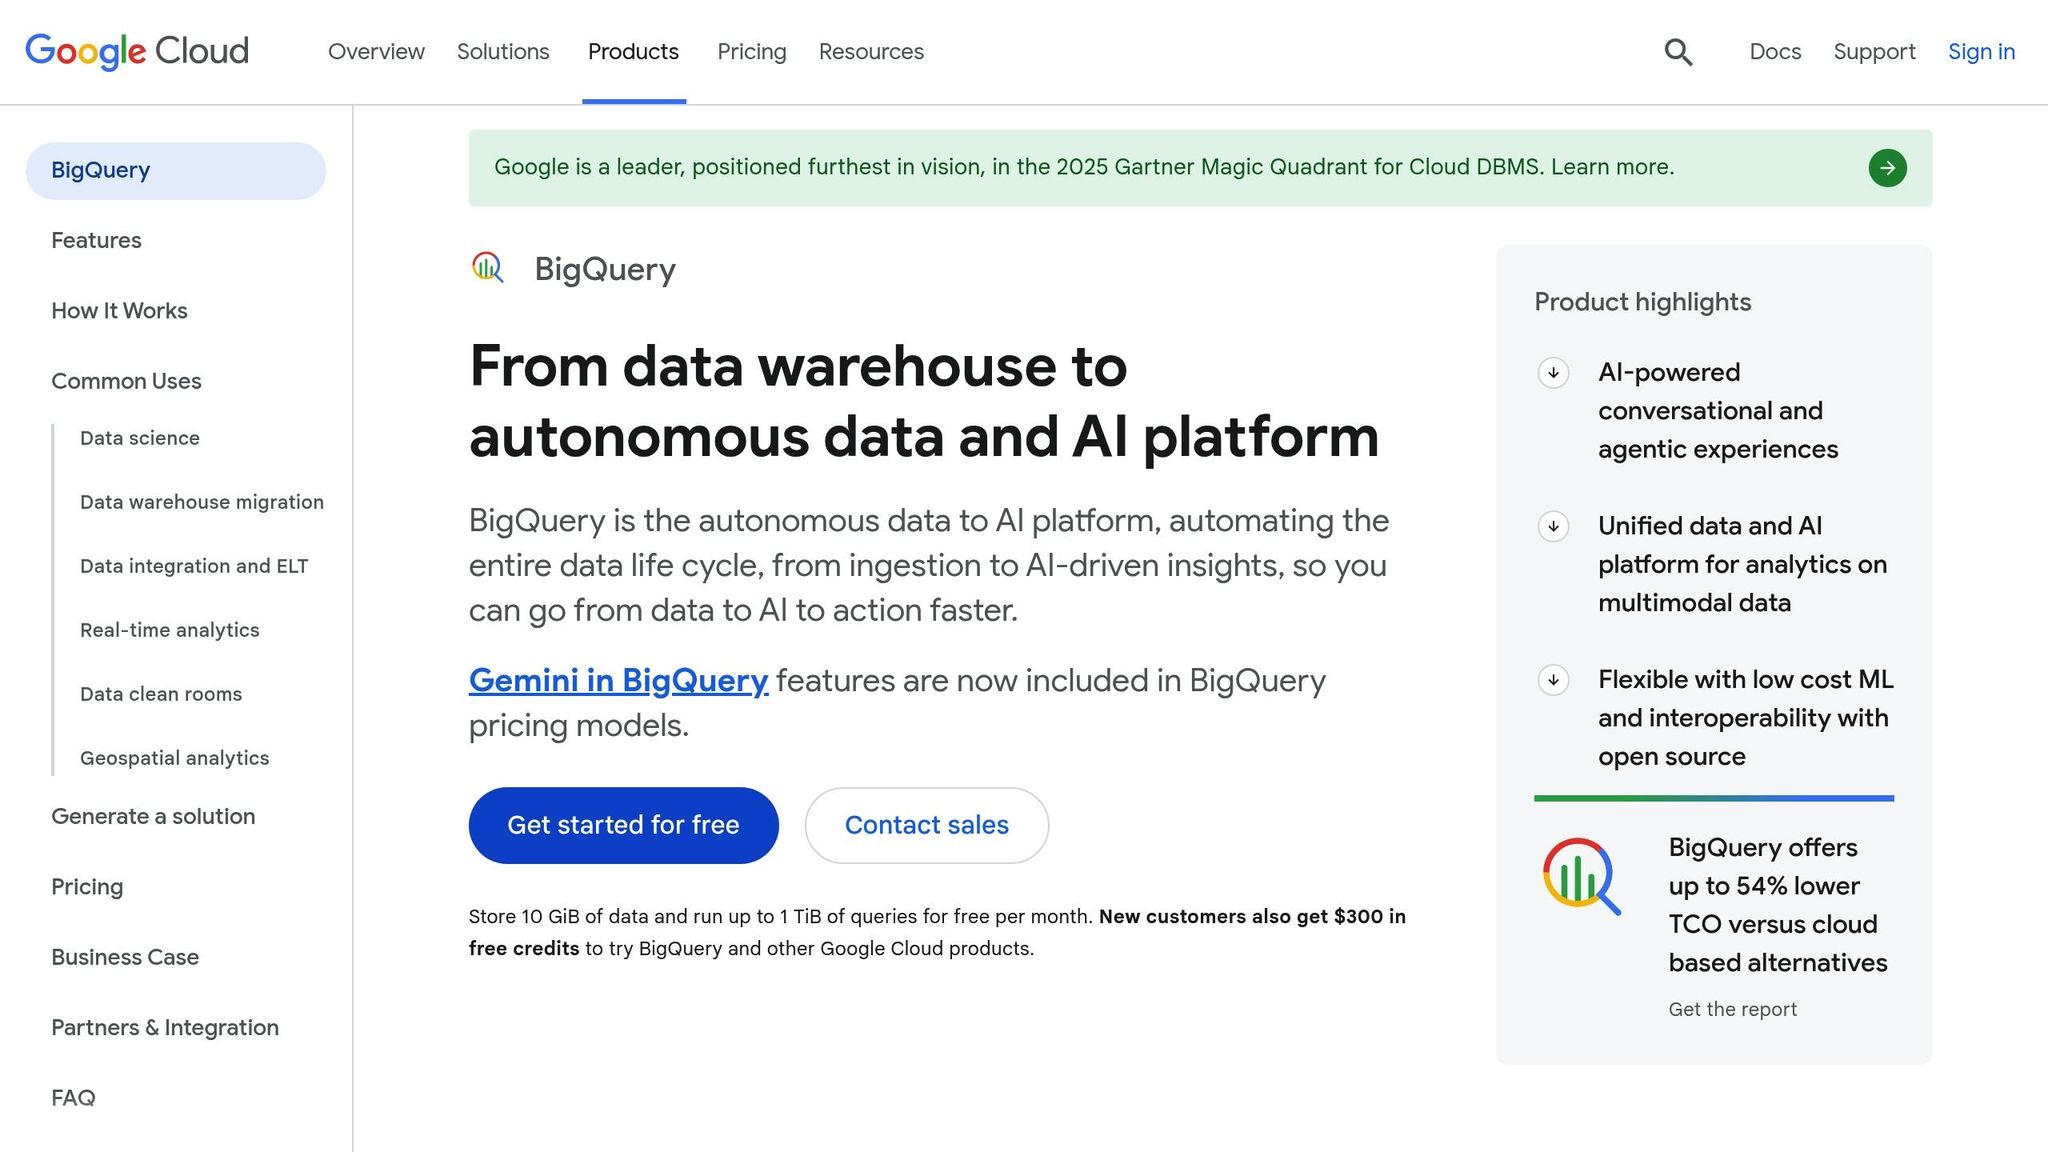
To analyze usage patterns and audit logs with SQL, you can set up a continuous export to BigQuery. Start by heading to Reporting > Data integrations > BigQuery Export in the Admin Console. For this setup, you'll need two key IAM roles: BigQuery Admin (roles/bigquery.admin) and Project IAM Admin (roles/resourcemanager.projectIamAdmin).
Next, add the service account gapps-reports@system.gserviceaccount.com as a Project Editor in your destination project. If your organization enforces a Domain Restricted Sharing policy, make sure to include the Google customer ID C02h8e9nw on your allowlist.
Once configured, the export includes historical data. Activity logs are typically available within 10 minutes, while usage reports may take 1–3 days to appear. Keep in mind that billing must be enabled on your Google Cloud project; otherwise, activity log data will not export.
| Feature | Activity Logs | Usage Reports |
|---|---|---|
| Availability | Within 10 minutes | 1–3 days delay |
| Historical Data | 180 days | 450 days |
| Export Cost | insertAll API charges apply |
Free export |
By default, exported data expires after 60 days unless you adjust the table expiration settings. To optimize query costs, always filter by _PARTITIONTIME along with time_usec or date when writing SQL queries. BigQuery tables are partitioned by day, aligned with Pacific Time (PT).
You can take this data further by creating visual dashboards with Cloud Monitoring to analyze trends and gain actionable insights.
Creating Dashboards with Cloud Monitoring
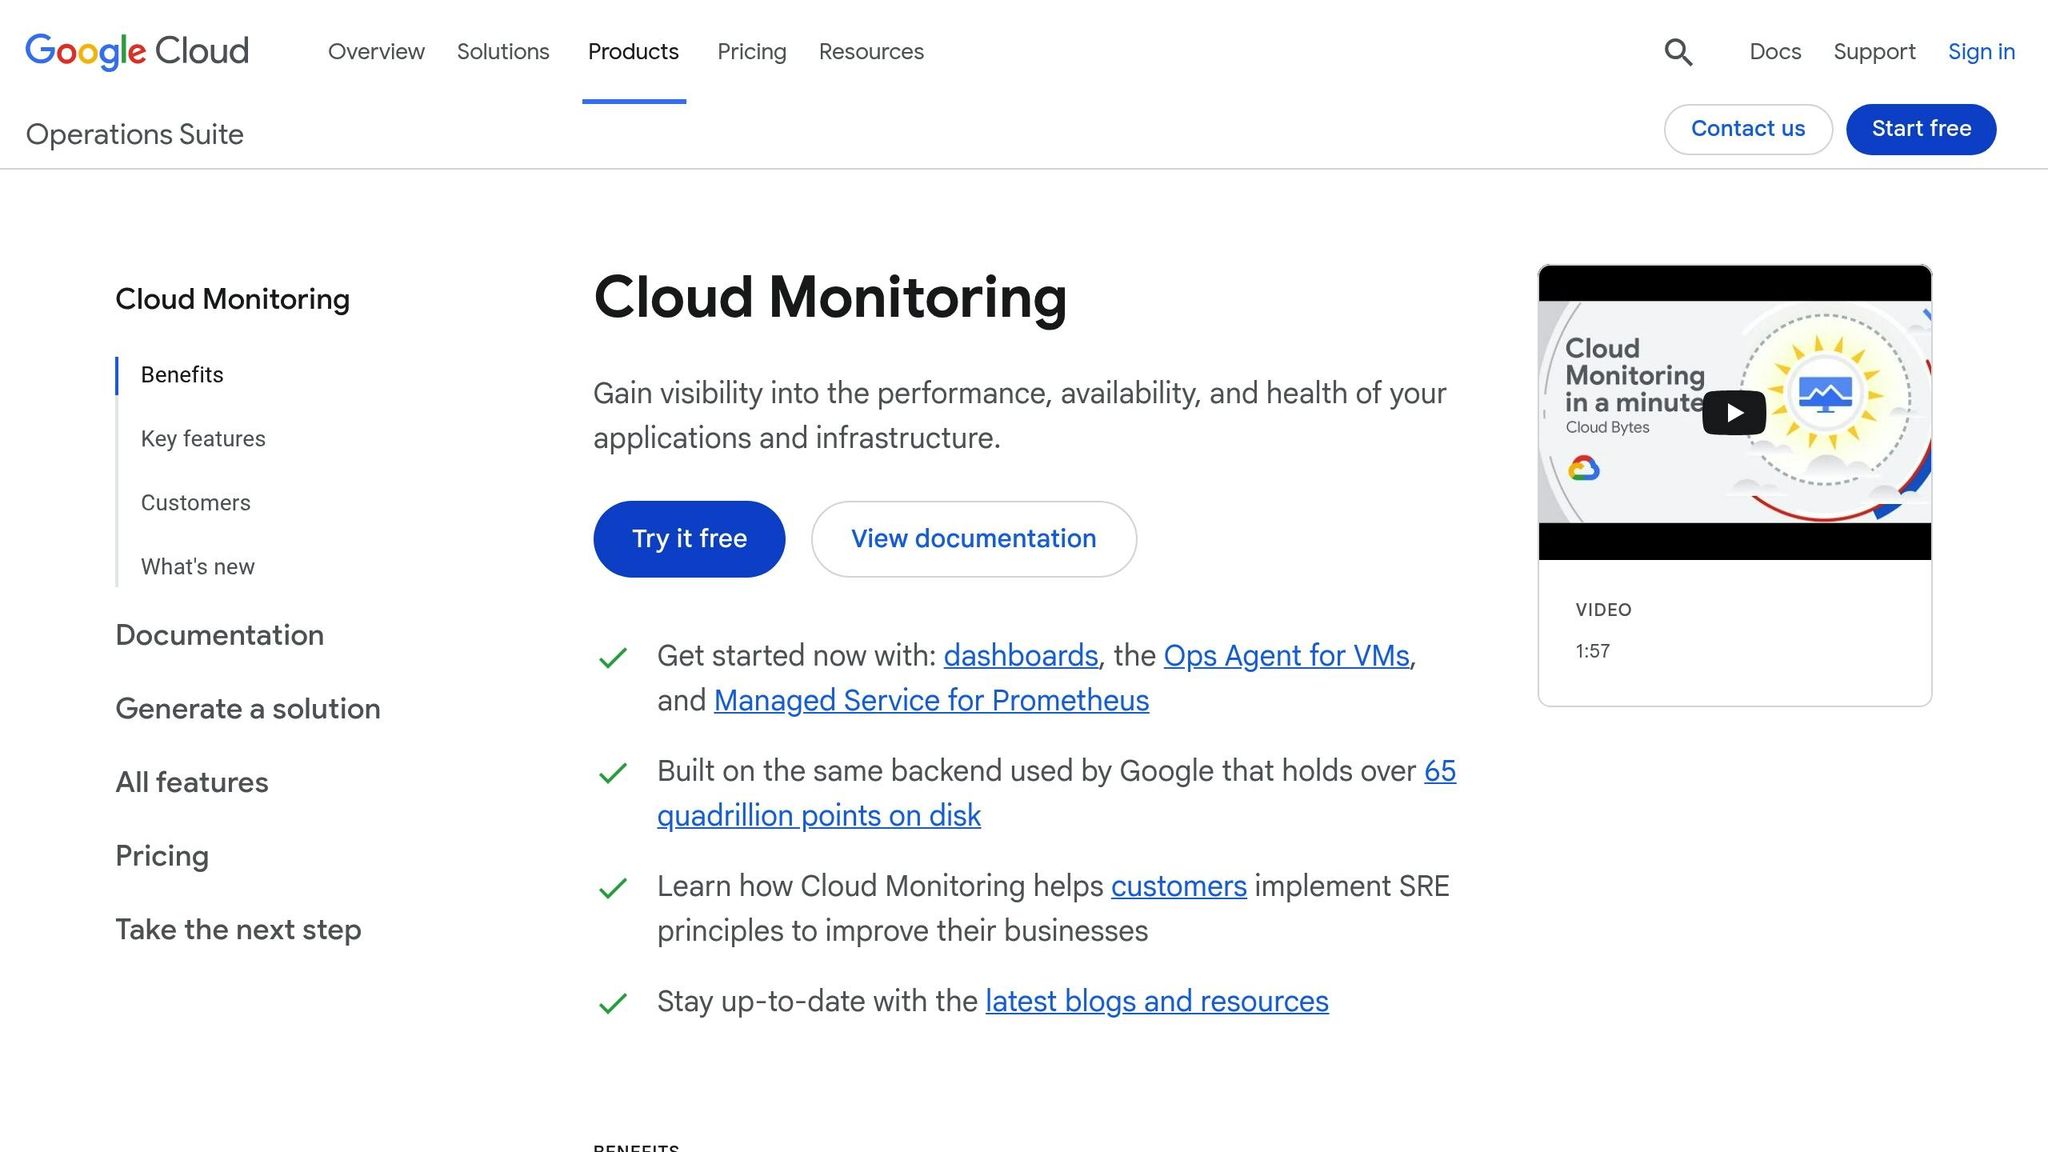
Once your data is exported, Cloud Monitoring can help transform it into meaningful insights. With built-in dashboards and a Metrics Explorer, you can view up to 6 weeks of metric history. For deeper trend analysis over longer periods, export metrics to BigQuery and visualize them using tools like Looker Studio.
When designing dashboards, aggregate data to at least a 1-hour level. This approach balances storage usage with readability and ensures dashboards load quickly. Use the Monitoring API’s alignment and aggregation features - like ALIGN_SUM and REDUCE_SUM - to reduce data points for smoother performance. Partitioning BigQuery tables by ingestion date or end_time can also improve query efficiency and lower costs.
For operational reliability, set up automated alerts with Cloud Scheduler to notify you of any failures in Drive inventory or log exports. This helps you quickly address issues and maintain seamless data tracking.
sbb-itb-c68f633
Tracking Third-Party and Custom App Usage
Your organization probably uses a mix of third-party integrations and custom applications alongside native Google Workspace tools. Keeping tabs on which apps are actively used - and which ones aren’t - can help you make smarter decisions about renewals, security policies, and IT budgets.
Monitoring API Metrics
Google Workspace automatically logs performance metrics for each API, making it easy to track activity. To access these, head over to Menu > More products > Google Workspace > Metrics in the Google Cloud Console. Here, you’ll find key data points like traffic volumes, error rates, and median latency for each integration.
The "Grouped by" feature allows you to organize metrics by response codes, APIs, or methods. This is particularly useful for spotting issues. For example, if a custom app shows a high percentage of 400-series error codes, it could signal authentication issues or incorrect API calls that need fixing right away.
| Monitoring Method | Data Provided | Tool/Interface |
|---|---|---|
| OAuth Token Reports | Token grants, revocations, third-party domains, and scopes | Reports API / Admin Console |
| Customer Usage Report | List of authorized apps and the number of users per app | Reports API |
| Workspace API Metrics | Traffic volumes, error rates, and median latency | Google Cloud Console |
Once you’ve reviewed these metrics, the next step is identifying which apps are underused.
Identifying Underused Integrations
To pinpoint apps that users rarely use, generate a Customer Usage Report using the accounts:authorized_apps parameter. This report provides details like the client_id, client_name, and the number of users (num_users) who have granted access to each application. With data spanning up to 450 days, you’ll get a clear historical perspective.
Compare these authorization numbers against your total user base. For instance, if only 5 out of 500 users have authorized an app, it’s clearly underutilized. Additionally, OAuth Token activity reports, available through the Reports API, track when users grant or revoke access tokens for third-party apps. These reports also include details like the third-party domain and the authorization scopes granted. Frequent revocations can be a red flag that an app isn’t meeting user needs.
In the Google Cloud Console, keep an eye out for declining traffic trends or consistently low API call volumes. You can filter metrics by API method to see which specific features of an app users aren’t engaging with. For custom Apps Script projects, check the Admin Console's Reporting section to review daily active users and script execution counts. If a script shows little to no activity, it might no longer be relevant.
Using AdminRemix to Track Software Usage
Google Workspace's built-in tools are a great starting point for tracking and reporting, but AdminRemix takes it a step further. By integrating seamlessly with your Google Workspace environment, AdminRemix tools deliver specialized solutions for more in-depth tracking. Each tool taps into the power of Google Sheets, making data analysis straightforward and efficient. Let’s look at how AssetRemix, Chromebook Getter/User Getter, and the Meet Enhancement Suite can provide valuable insights to enhance your Google Workspace management.
Using AssetRemix for IT Asset Management
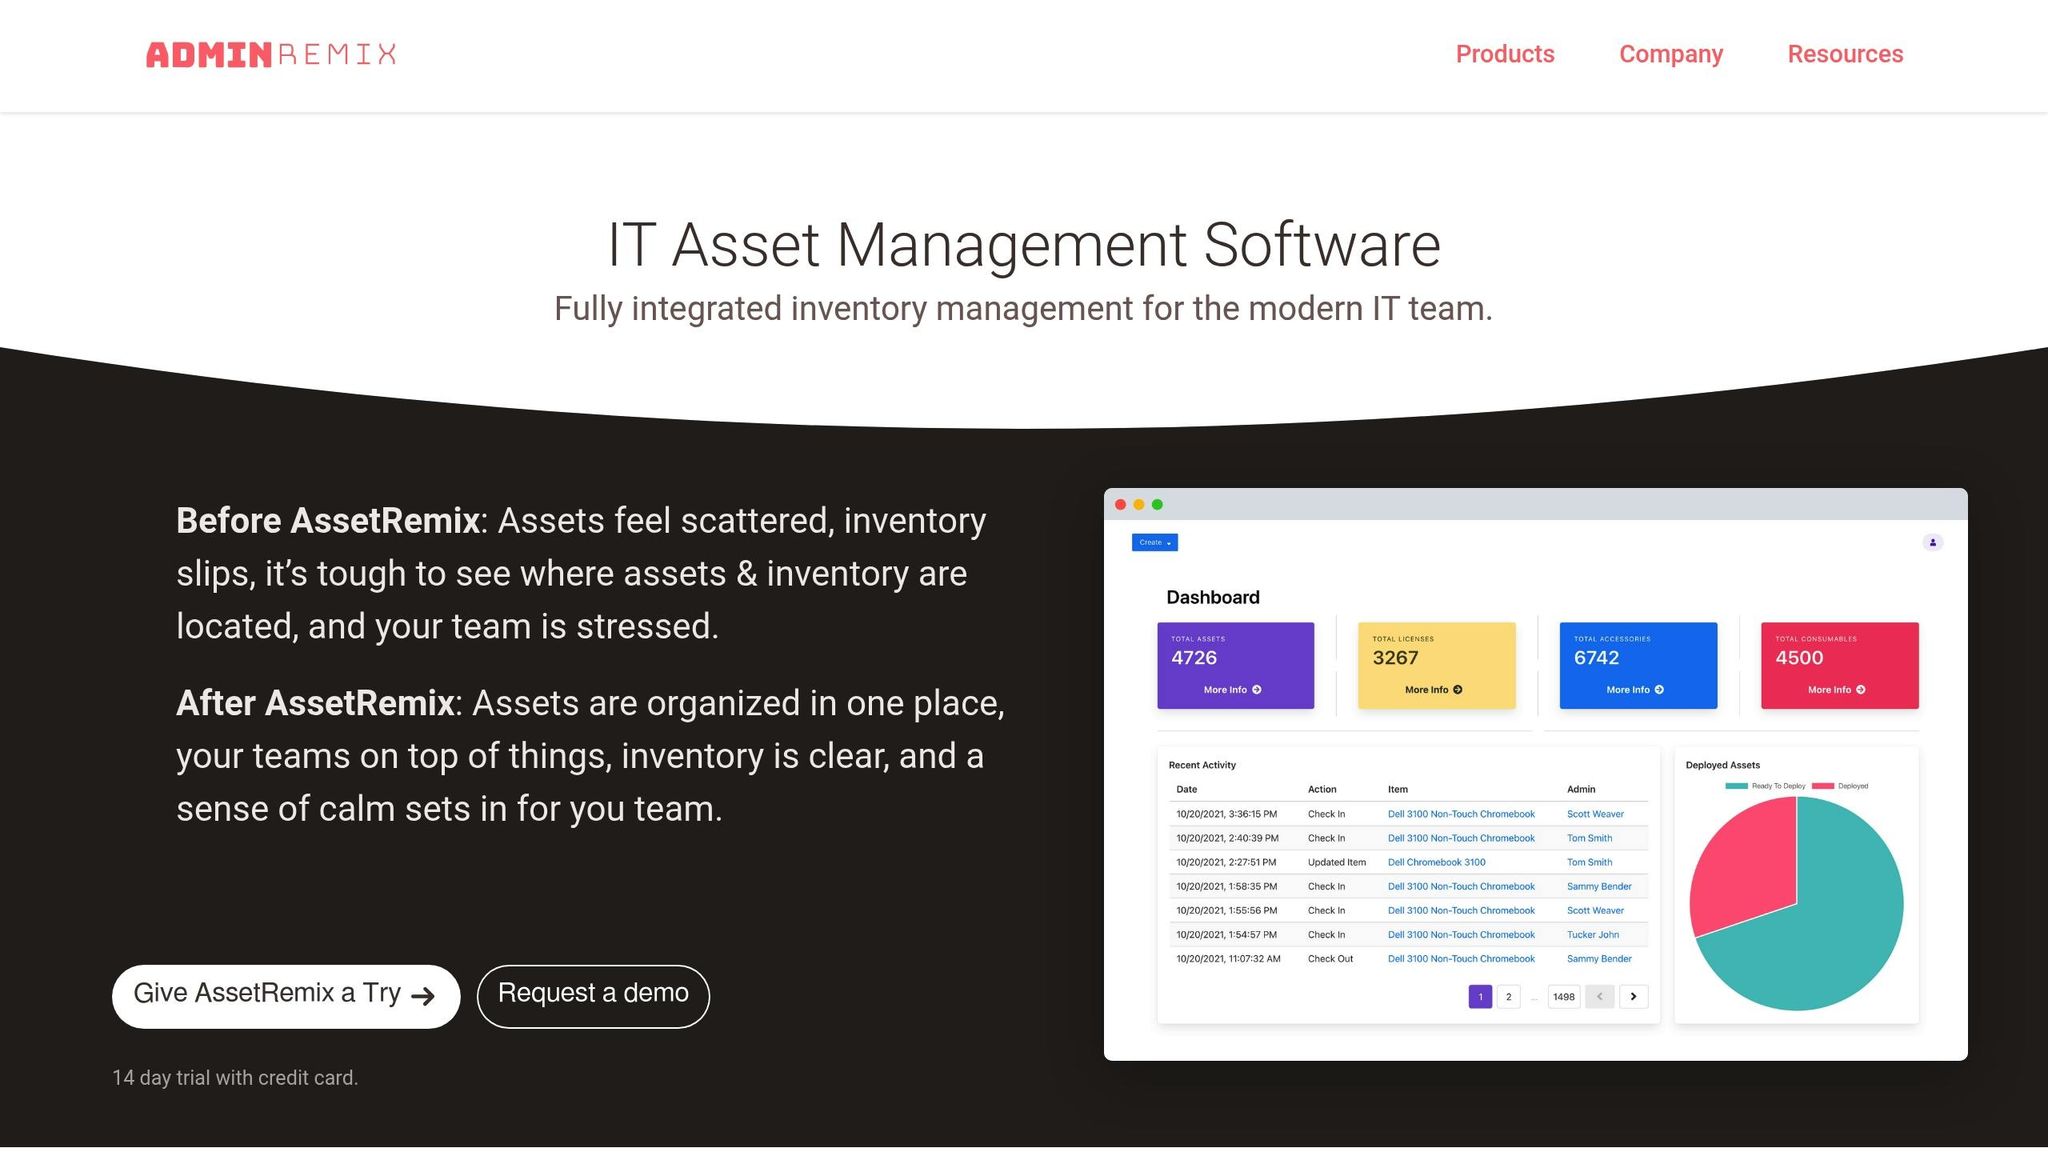
AssetRemix bridges the gap between IT assets and Google Workspace users, offering a unified view of hardware and software data. It tracks the entire lifecycle of IT assets, links devices to specific users, and incorporates help desk support to monitor software-related issues. This means IT teams can easily identify performance trends, pinpoint areas for training, and address support needs. By aligning asset performance data with usage reports, administrators get a complete picture of their IT ecosystem, helping them make smarter, data-driven decisions.
Chromebook Getter and User Getter
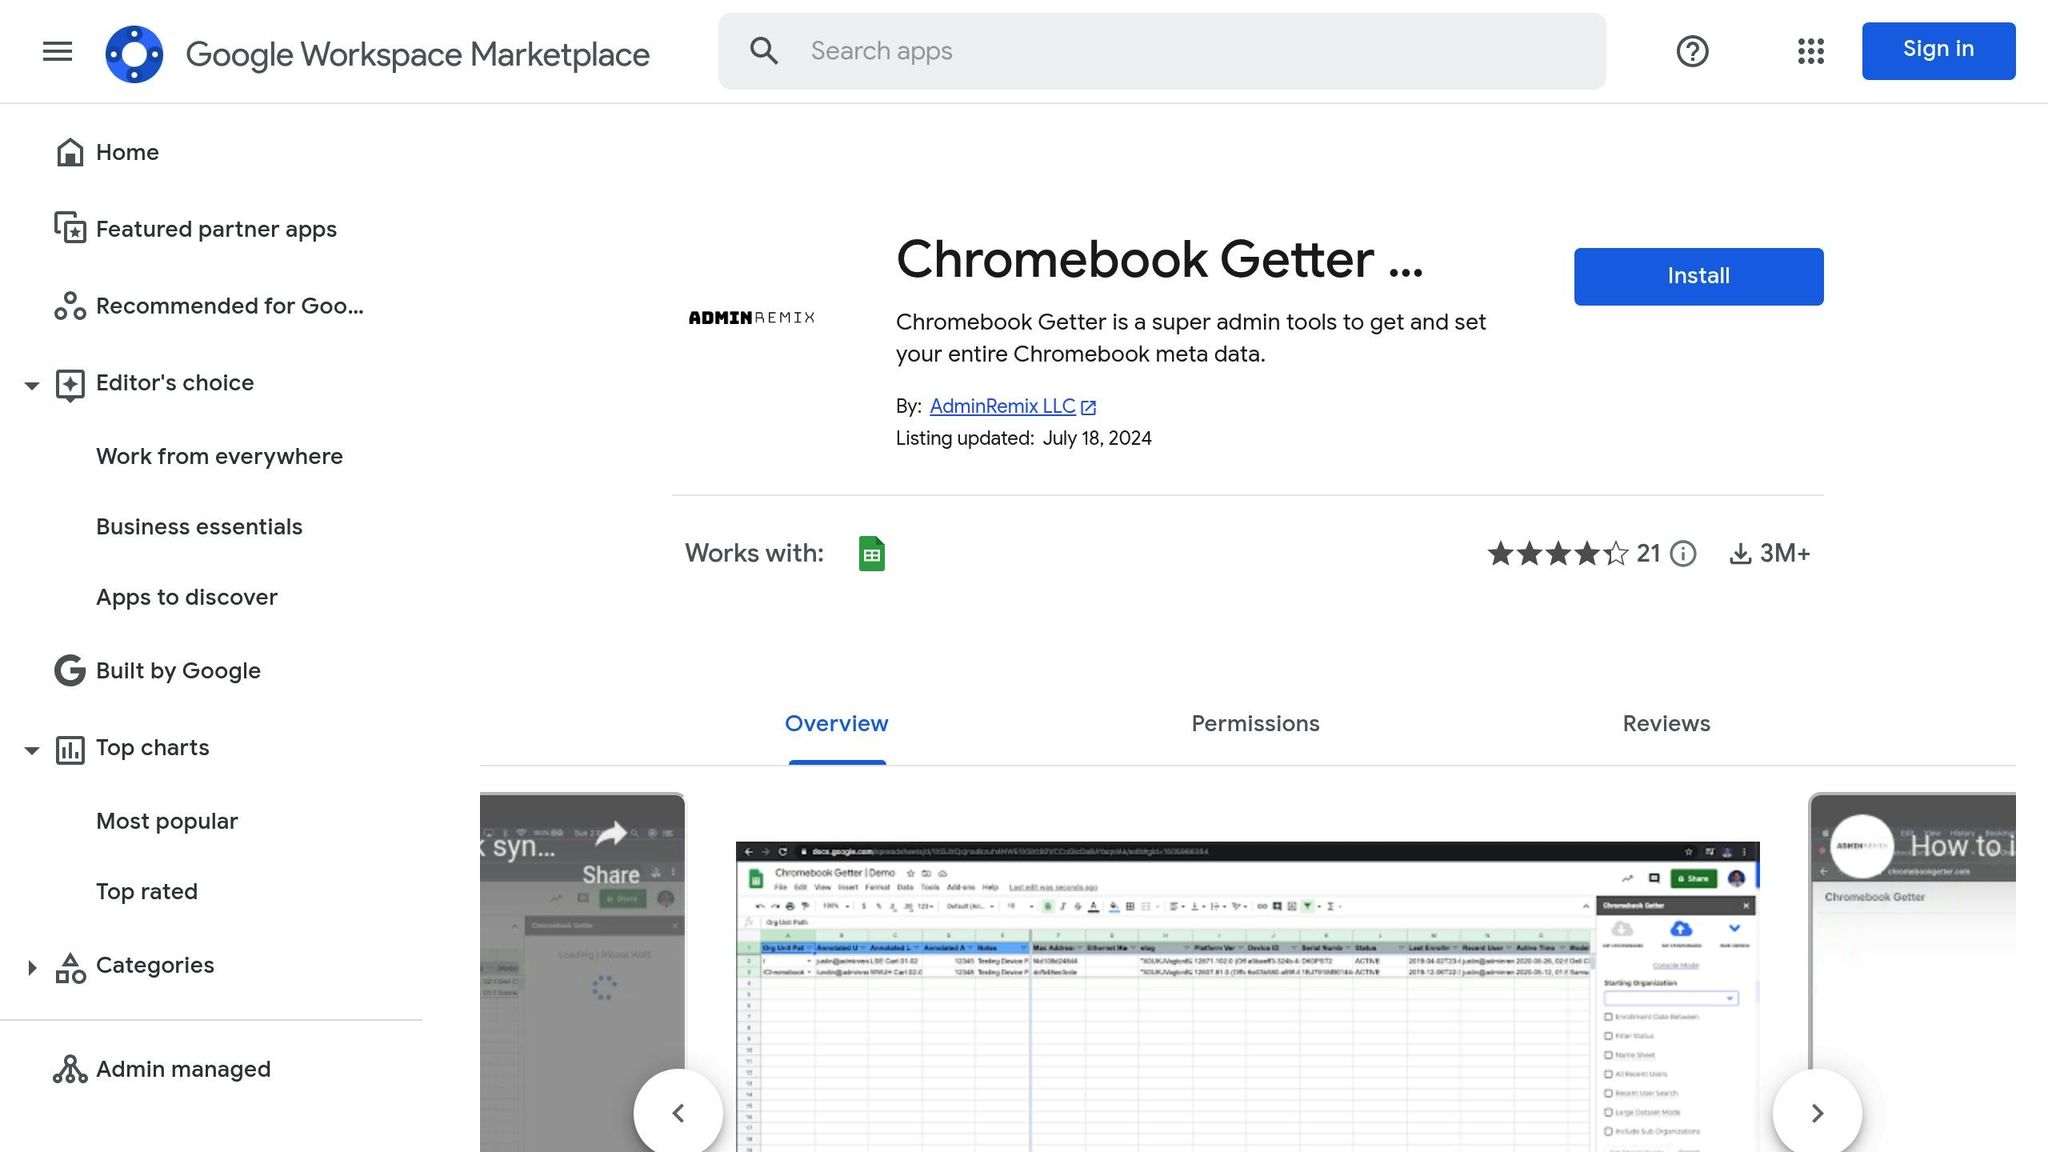
Chromebook Getter is a Google Sheets add-on, boasting over 3,000,000 installs. It allows you to pull detailed device metadata directly into a spreadsheet. With the "Get Chromebooks" action, you can download your entire fleet's data - including OS versions, Auto Update Expiration (AUE) dates, and activity history. This information can then be paired with usage reports for deeper analysis.
Similarly, User Getter simplifies bulk management of G-Suite user metadata, streamlining tasks like updating user profiles.
Philip Helmers from SWBOCES LHRIC shared, "I signed up for Chromebook Getter because it's faster than getting what I need with GAM command lines".
By cross-referencing Google Workspace usage with assigned devices, IT admins can spot underutilized hardware and make informed decisions about reallocating resources or adjusting software licenses.
Meet Enhancement Suite for Google Meet Insights
When it comes to meetings, tracking real-time metrics can provide even more clarity. The Meet Enhancement Suite boosts Google Meet with over 40 features, including an "Auto Record" function that automatically captures meetings for compliance and documentation purposes. Other tools like "Mute All" and "Remove All" help streamline meeting moderation.
Pair these features with Google Meet's native logs to unlock detailed insights into meeting metrics such as duration, participant numbers, and connection quality. This data can be exported to Google Sheets for further analysis, giving IT admins a clear view of collaboration trends. Armed with these insights, teams can optimize their meeting infrastructure to better align with actual usage patterns.
Setting Up Reporting and Governance Practices
Using data from Google Workspace and AdminRemix tools, you can create a structured reporting and governance framework to turn raw insights into actionable strategies. Without a clear system in place, IT teams risk missing critical information.
Developing a Reporting Schedule
It's important to separate activity reports (like logins or Drive edits) from broader usage reports. This distinction ensures that the right data is used for specific reporting purposes.
- Weekly Monitoring: Automate Login Activity and User Usage reports to keep track of engagement trends and security events. This regularity helps catch potential security issues early and monitor active user counts effectively.
- Monthly Reviews: Focus on app adoption metrics during these reviews. For example, use the "Drive - last active time" column to identify users who aren’t leveraging cloud storage before the data resets on the first of the month. Similarly, track Google Chat usage over a 28-day period to assess internal communication health. Monthly audits should also include reviewing OAuth Token activity reports to monitor third-party access.
- Quarterly Audits: Save deeper governance tasks, like storage management and license optimization, for quarterly reviews. Identify users nearing storage limits to prevent disruptions, and compare licensed users to active users to optimize costs.
Keep in mind that the Reports API allows a maximum reporting period of 450 days for user usage data. Most Admin console metrics, however, only cover the past six months. Admins can export up to 100,000 rows of data from the Apps usage report to Google Sheets or CSV for further analysis. Following this schedule ensures you’re tracking the most relevant metrics consistently.
Key Metrics to Monitor
Not all metrics are equally important. Focus on those that directly influence security, budget, and productivity.
| Metric Category | Key Parameters to Track | Reporting Frequency |
|---|---|---|
| Account Security | 2-Step Verification enrollment, Password strength, Last login time | Weekly |
| App Adoption | Active users (1, 7, 30-day), Drive files added/edited | Monthly |
| Communication | Emails sent/received, Chat messages sent, Meet call duration | Monthly |
| Storage Management | Total storage used (MB), Storage used (%) | Quarterly |
| Governance | External vs. Internal file sharing, OAuth tokens granted | Quarterly |
For security and compliance, track metrics like 2-Step Verification enrollment, password length compliance, and password strength. Monitor active users across tools like Drive, Meet, Chat, and Voice over 1-day, 7-day, and 30-day periods to evaluate tool adoption.
When it comes to license and account management, review user account statuses (Active, Blocked, or Suspended) and compare total licensed users with active users. For storage, track total usage in megabytes and as a percentage to pinpoint users nearing their limits and manage data growth effectively.
Use the "View by date" selector to analyze activity over 1, 7, and 30 days for a detailed look at usage trends. Reports can also be filtered by Organizational Unit (OU) or Group to compare software adoption and usage patterns across different departments. These insights help guide informed IT decisions.
Aligning Findings with IT Goals
Data becomes powerful when it informs decisions. Tie your tracking metrics to three main areas: security reviews, budget planning, and staff training.
For security reviews, usage data can reveal suspicious login attempts and highlight when documents are shared outside the domain. Enable admin email alerts for unusual login attempts or changes in service settings to maintain real-time security oversight. Monitor external file sharing - whether publicly, via links, or directly with individuals outside the domain.
Budget planning benefits from identifying underutilized tools and reallocating licenses. Research shows that improving asset management within Google Workspace can increase productivity and cut operational costs by 15–20%. Regularly review licenses to eliminate unused accounts or unnecessary department-level allocations. Organizations that implement automated workflows often achieve up to 96% better compliance and data security.
For staff training programs, metrics like "last active time" for apps such as Classroom or Drive can highlight team members who may need additional support or training. If some departments show low adoption rates for collaboration tools, schedule targeted training sessions to boost their engagement.
Be aware that report data isn’t real-time. Check the "latest date" column in the Admin console to understand how current the data is. Some columns may even be marked with an asterisk, indicating outdated information. By accounting for these data limitations, you can create governance practices that align closely with proactive IT management needs.
Conclusion
Keeping tabs on software usage within Google Workspace empowers IT admins to make smarter decisions around security, resource allocation, and productivity. With tools like the Admin console's built-in reports, audit logs, and BigQuery exports, you can track everything from 2-Step Verification enrollment to storage usage and third-party app authorizations. This level of insight helps you spot security vulnerabilities, manage licenses effectively, and better understand how teams are using tools like Drive, Meet, and Chat. By pairing these native tools with AdminRemix's specialized solutions, you can simplify and enhance your tracking process even further.
Regular monitoring is key. Weekly reviews of login activity can help you catch potential security issues early. Monthly check-ins might uncover gaps in app adoption, and periodic audits allow you to stay on top of storage limits and unused licenses.
AdminRemix tools add another layer of functionality. For example, AssetRemix centralizes IT asset management and help desk tasks, while Chromebook Getter allows you to update device metadata in bulk using Google Sheets. This eliminates time-consuming manual barcode scanning and provides quick access to details like AUE dates, OS versions, and last known IP addresses. Similarly, User Getter streamlines G‑Suite user data management, and Meet Enhancement Suite introduces over 40 features to improve Google Meet functionality.
By combining Google Workspace's native reporting features with AdminRemix tools, you create a robust tracking system. This setup enables you to pull device serial numbers, monitor hardware health across your fleet, and perform bulk actions - like deprovisioning or power washing devices - directly from spreadsheets. These capabilities not only strengthen security but also simplify day-to-day operations.
To get started, focus on the essentials: set up automated weekly reports and enable admin email alerts for suspicious activity. Once you're comfortable with the data, you can explore BigQuery exports and custom dashboards for deeper insights. Turn these metrics into actionable steps to safeguard your organization, cut costs, and boost productivity.
FAQs
How can I efficiently manage Google Workspace licenses?
To keep your Google Workspace licenses under control, start by diving into the Admin console's usage reports. Look for accounts with little or no activity over the past 30 days - these inactive or low-usage accounts are prime candidates for adjustment. If you're on a flexible plan, you can delete these accounts to automatically lower your license count. For annual contracts, make sure to tweak your seat count during the renewal period to avoid paying for unused licenses.
Want to make things even easier? Tools like AdminRemix can help by pulling license data into Google Sheets, giving you a clear view of trends and letting you handle bulk updates with ease. Also, consider setting up regular reviews and renewal alerts to keep your license usage in check. This way, you can align your subscriptions with your organization's actual needs while avoiding unnecessary costs.
What advanced security features are included in premium Google Workspace editions?
Premium versions of Google Workspace, like Enterprise Standard/Plus and Education Standard/Plus, come with advanced security tools to help IT teams protect their organizations. One standout feature is the Security Investigation Tool, which lets you perform actions like saving, sharing, deleting, and duplicating investigations. It also allows for creating nested queries, grouping results by specific attributes, and setting up to 100 activity rules.
Admins can also create custom charts on the security dashboard, explore deeper insights by pivoting to other attributes, and take immediate actions straight from search results. These features provide IT teams with greater control and visibility to strengthen their organization's security.
How can I analyze Google Workspace data using BigQuery?
To dive deeper into analyzing Google Workspace data, you can export your logs and usage reports directly to BigQuery using the export configuration in the Admin console. Once your data is in BigQuery, you can leverage Standard SQL queries to uncover trends, perform security audits, or understand how resources are being utilized.
This approach empowers IT admins to design custom reports and dashboards that align with their organization's specific requirements, simplifying workflows and supporting better decision-making.