
How To Create Custom IT Asset Reports
Creating custom IT asset reports is simpler than you think and can solve major challenges like poor asset tracking, which costs companies an average of $1.2 million annually. With tools like AdminRemix and its AssetRemix feature, you can track asset locations, usage, and lifecycle stages, helping you save time and money. For example, one company saved $50,000 per year by identifying unused software licenses. Here’s how to get started:
- Set Up AdminRemix: Create an account, choose the All-In plan ($99/month or $999/year), and access the AssetRemix dashboard.
- Prepare Data: Standardize asset details in CSV or Excel files, ensuring accuracy and consistency.
- Assign Roles: Use role-based permissions to manage access and secure data.
- Build Reports: Use the Report Builder to customize layouts, select metrics, and apply filters.
- Share Insights: Export reports to Google Sheets, download as CSV, or share securely with your team.
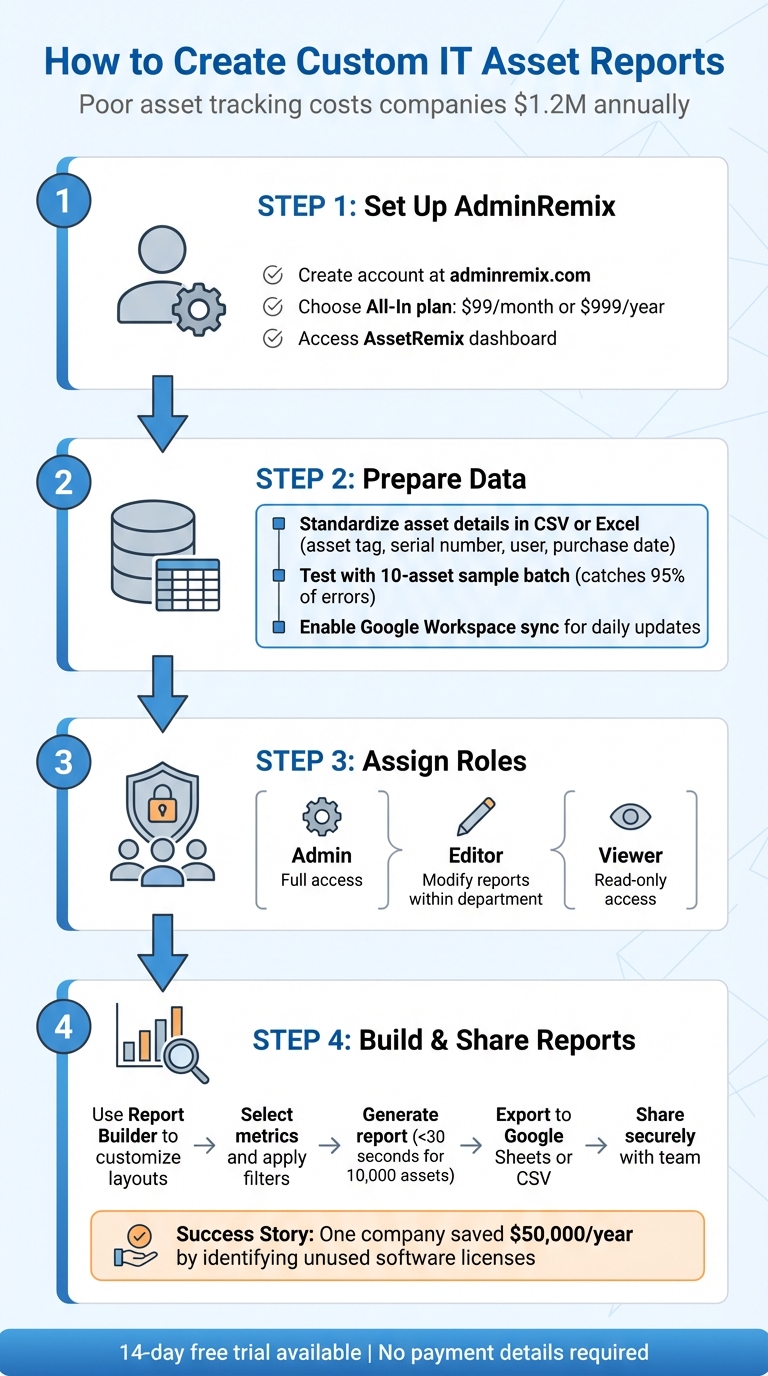
4-Step Process to Create Custom IT Asset Reports with AssetRemix
What You Need Before Creating Custom IT Asset Reports
Before diving into custom IT asset reports, it’s crucial to have your AdminRemix account set up with AssetRemix access, standardized asset data, and clear user roles. These foundational steps prevent issues like data inconsistencies or security gaps that could complicate your reporting process. Understanding what is IT asset management is the first step toward effective reporting. Let’s break down what you need to get started.
AdminRemix Account and AssetRemix Access
First, ensure you have an AdminRemix account with the All-In plan to unlock AssetRemix’s full reporting features. Setting up your account is simple: head to adminremix.com, click "Sign Up", and enter your email, organization details, and password. After verifying your email, choose the All-In plan, which costs $99.00 per month or $999.00 per year if paid annually. Not ready to commit? AdminRemix offers a 14-day free trial with no payment details required. Once your account is active, you can access the AssetRemix dashboard directly from the sidebar to start creating reports.
Data Preparation and Integration
Accurate reports depend on clean, well-organized data. Prepare your asset details in CSV or Excel (.xlsx) formats, ensuring columns include information like asset tag, serial number, user assignment, and purchase date (formatted as MM/DD/YYYY). Standardize entries - for example, always use "Dell Latitude 5420" instead of variations - and eliminate duplicates using Excel’s tools. Consistency here directly impacts the quality of your report metrics.
For organizations using Google Workspace, enable directory sync by navigating to Integrations > Google Workspace > Authorize API in your AdminRemix settings. This feature synchronizes your organizational unit structures for Chromebooks and users with daily automatic updates. Before importing large datasets, test with a 10-asset sample batch to identify formatting issues in advance - this step catches 95% of errors. If your dataset exceeds 50,000 rows, split it into smaller files to avoid upload issues.
User Permissions and Roles
Proper role assignments are essential for both efficiency and security. AssetRemix includes three main roles:
- Admin: Full access to create and edit reports across all data.
- Viewer: Read-only access with filtered data views.
- Editor: Can modify reports but only within department-specific boundaries.
Assign roles by navigating to Account Settings > Users > Roles. For added control, use granular permissions like "Asset Reports Only" to restrict access to sensitive data. For example, IT managers might need organization-wide access, while help desk staff are limited to their department's devices. Every account must have at least one SuperUser for high-level configurations. Avoid enabling "View Assigned Items Only" for users who need to generate comprehensive reports, as it could block access to critical features.
To ensure permissions are correctly assigned, review the Audit Logs under the Security tab. Look for actions such as "Report Generated" to confirm they align with the assigned roles. For organizations with over 500 users, role-based access can lower the risk of security breaches by 40%, making it a smart strategy for safeguarding data.
sbb-itb-c68f633
How to Create Custom IT Asset Reports
With your account ready and your data in place, you can start building custom reports tailored to your organization’s needs. AssetRemix offers a variety of report types: Basic (charts for assets and accessories), Searchable (filtered activity and tickets), Device Audit (user-device associations), Aggregation (rolling reports), and Filter Reports (saved searches). These options make it easier to visualize and analyze your IT inventory. Here’s how to create your reports step by step.
Step 1: Access the AssetRemix Dashboard
Head to adminremix.com and log in using your SSO credentials or email and password. Once logged in, select AssetRemix from the sidebar menu to open the dashboard. At the top, you’ll find a summary showing totals for assets, licenses, accessories, and consumables. Before diving into report creation, confirm your inventory data is accurate. Click the "More Info" link under any category to view detailed asset lists. Use the search bar to refine your view (e.g., search for "laptops model: Dell Latitude") and verify counts. Additionally, check the Recent Activity Table for updates like check-ins or modifications to ensure your data reflects the latest changes. Once you’ve confirmed your dashboard data, you’re ready to set up your report.
Step 2: Configure Report Parameters
Go to the Reports home screen and click "Report Builder" to start customizing your report. Begin by selecting the report type, then choose the entity (e.g., Assets, Tickets), key metrics (like lifecycle status, location, or value), date ranges (MM/DD/YYYY), and any filters (e.g., "Finance Dept"). If needed, incorporate external data by clicking "Integrations" in the parameters panel. Authenticate your source (e.g., Google Workspace), map fields (like syncing "device ID" to "serial number"), and run a preview query with 100 sample records to ensure the data pulls correctly. Use "+And" logic for mandatory conditions and "+Or" logic for optional ones. For field entries, select the "In" operator and press Enter to apply them. Once all parameters are set, move on to designing your report layout.
Step 3: Customize Report Layouts
Build your report by dragging fields like "Asset Type", "Value USD", or "Assigned User" from the left panel into your table. Choose your chart types from the visualization toolbar - bar charts work well for lifecycle distribution, while pie charts are great for location breakdowns. Use the drag-and-drop grid layout to arrange elements, previewing in real-time to ensure everything looks right (e.g., US formats like 1,234.56 USD with commas for thousands). To keep things clean, use the table sort button to hide optional columns (like "Location" or "Purchase Cost") from the final report. For exporting, click "Export > Sheets" to send data to Google Sheets, where live-linked updates allow further analysis, or choose "Download CSV" for static files formatted for Excel. Google Sheets exports even retain formulas, so you can perform calculations like summing asset values over $100,000. Once your layout is complete, you’re ready to generate and share your report.
Step 4: Generate and Share Reports
Click "Generate Report" to process your data - reports for datasets under 10,000 assets typically generate in less than 30 seconds. Review the preview pane to double-check layout and accuracy, like confirming a pie chart showing 40% Chromebooks or a table listing 1,200 assets with a total value of $2,345,678.90. Once everything looks good, securely share your report with your team. Use the "Share" dialog to assign access by role (e.g., "Finance Team") and set expiration dates (e.g., 30 days). You can also define access levels (Admin, Technician, Viewer) to control who can see or edit the report. For dashboard integrations, export to Looker Studio by copying the embed code or API token. Save your report to "My Reports" for private use or "Public Reports" to share it with your team, based on your permissions. To protect user privacy, toggle "Redact Emails" when sharing links - this hides email addresses while keeping names visible.
Best Practices for IT Asset Reporting
Maintaining Data Accuracy and Consistency
Accurate data is the backbone of effective IT asset reporting. One way to achieve this is by automating asset discovery with tools like network scans and agents, which help minimize manual errors. Did you know IT teams lose nearly 29% of their workweek to manual tasks like updating spreadsheets? That’s a lot of time wasted. With AssetRemix, you can centralize all asset information into a single dashboard, ensuring everyone works from the same, consistent data. Tracking assets throughout their lifecycle - from procurement to retirement - also helps preserve critical historical details, such as past ownership or maintenance records.
Ghost assets are another hidden cost you can tackle through regular self-audits. For instance, a company managing its assets with spreadsheets could lose up to $50,000 annually on missing or untracked items.
"Systems should do this work. Without having to relegate time and brain matter to tracking artifacts... IT employees can focus more on what matters most." - Atlassian
To keep your data fresh, consider creating custom fields for details like department codes, cost centers, or warranty dates. Pair this with a rolling 30-day update cycle to ensure your metrics stay current and eliminate outdated information. This kind of accuracy doesn’t just prevent errors - it can also save money. Organizations have reported cutting software expenses by up to 30% by optimizing licenses through precise asset reporting.
Fixing Common Problems
Even with a clean dataset, occasional hiccups in reporting are inevitable. Addressing these issues promptly ensures smoother workflows and minimizes disruptions.
If a report isn’t visible, check whether the "Public" checkbox was selected when saving it. By default, reports are private under "My Reports" unless explicitly shared. Incorrect data? Double-check your filter logic in the Report Builder. Keep in mind that "+And" applies strict conditions, while "+Or" allows more flexibility. For pinpoint accuracy, use "Exact Match" filtering.
Outdated information can be resolved by enabling directory sync and integrating third-party tools to automate real-time updates. If a shared dashboard link has been compromised, the "Revoke All" feature lets you immediately disable access. Missing data points in your asset view? Use the "Table Sort" button to reveal hidden columns.
Managing Reports for Large Organizations
For larger organizations, managing reports across multiple teams and departments can get complicated. The All-In plan ($99/month or $999/year) supports unlimited assets, making it ideal for larger setups. To keep things organized, separate "My Reports" for personal use from "Public Reports" for team-wide access. This reduces clutter and ensures everyone sees only the data relevant to them.
Standardization is key for large teams. Create dashboard templates tailored to specific departments so everyone in a given role tracks the same KPIs. This approach eliminates confusion and ensures consistency across the board. For external stakeholders who don’t use AssetRemix, you can generate shareable dashboard links with the option to revoke access immediately after a presentation.
Role-based access control also plays a big role in managing reports at scale. As mentioned in the User Permissions and Roles section, these controls determine who can create, edit, or view specific reports - an essential feature for maintaining order in larger organizations.
Conclusion
Once you've got the hang of building reports, you can use these insights to make smarter, more strategic decisions. Creating custom IT asset reports is a clear and manageable process. By following the steps in this guide - starting from accessing the AssetRemix dashboard to setting parameters, designing layouts, and generating shareable reports - your IT team can turn raw data into insights that lead to better decisions. These reports give you the clarity needed to allocate resources wisely, cut unnecessary costs, and plan budgets more effectively.
AssetRemix simplifies reporting with tools designed to tackle issues like visibility, efficiency, and cost control. Features such as rolling windows that update daily, advanced filtering for precise data analysis, and the ability to share public reports make it easy to stay on top of your IT assets. Instead of spending hours manually updating spreadsheets, your team can focus on bigger priorities - whether that’s improving service delivery, planning for asset lifecycles, or showcasing ROI to leadership.
Customizable fields let you adapt reports to meet your organization's needs, while options for exporting and automating bulk actions cut down on repetitive tasks, helping your team manage IT assets more effectively.
"Our customers save time and money with AdminRemix software solutions." - AdminRemix
Whether you're running a small IT department or managing assets across multiple sites, the combination of automation, detailed filtering, and collaborative reporting ensures your team always has access to accurate, up-to-date data. With the All-In plan starting at $99/month for unlimited assets, you can apply the steps in this guide to turn IT asset management into a strategic advantage.
FAQs
Which report type should I use for my goal?
The type of report you choose should align with your specific goals:
- Basic Report: Great for visualizing data with charts, especially for assets or accessories.
- Searchable Report: Perfect if you need to filter or search through data efficiently.
- Device Audit Report: Use this to get detailed insights about users and their devices.
- Aggregation Report: Ideal for viewing summarized data in a clear format.
- Filter Report: Lets you save and reuse custom search criteria for convenience.
Select the option that matches your requirements.
How do I keep asset data accurate over time?
To keep your asset data accurate, make it a habit to review and update your records regularly. Leverage tools like Device Audit Reports and Filter Reports to identify any discrepancies or outdated entries. Custom reports that focus on details like asset status, assignments, or recent activity can give you a clearer picture of your assets' conditions. Simplify this task by automating periodic reports through the Report Builder. Regular audits and updates will help ensure your data remains up-to-date and dependable.
What’s the safest way to share reports externally?
When sharing reports externally, it's crucial to prioritize security. Using encrypted links, password protection, and role-based access control are effective ways to safeguard sensitive information. These steps help ensure that only the intended recipients can access the data, minimizing the chances of it falling into the wrong hands.