ChromeOS Fleet Monitoring: Best Practices for IT
If you don’t set clear rules for ChromeOS monitoring, small device issues turn into missed updates, bad policy settings, and blind spots fast.
I’d sum this up like this: to keep a ChromeOS fleet in check, you need four things working together from day one:
- Device health checks with fixed sync and offline rules
- Policy checks for settings like guest mode, developer mode, verified boot, and forced enrollment
- Update tracking for version lag, reboot delays, and AUE status
- Reports and follow-up workflows so every issue has an owner, due date, and ticket
The article’s core point is simple: Google Admin only helps if reporting is turned on, thresholds are written down, and teams follow the same review routine every day, every week, and every month. It also sets clear numbers, like flagging many user devices that haven’t synced in 24–48 hours, treating kiosks more tightly at 12–24 hours, and marking devices as non-compliant when they’re more than two Stable versions behind or stuck in reboot required for over 72 hours.
You’ll also see a strong process for spotting OU placement errors, stale telemetry, repeat re-enrollments, AUE risk, and alert noise. The big takeaway: monitoring is not just watching dashboards. It’s a fixed system for detecting, triaging, assigning, fixing, and documenting each issue.
If I had to put the whole article into one sentence, it would be this: turn ChromeOS monitoring into a scheduled checklist with plain thresholds, shared dashboards, and a set response path.
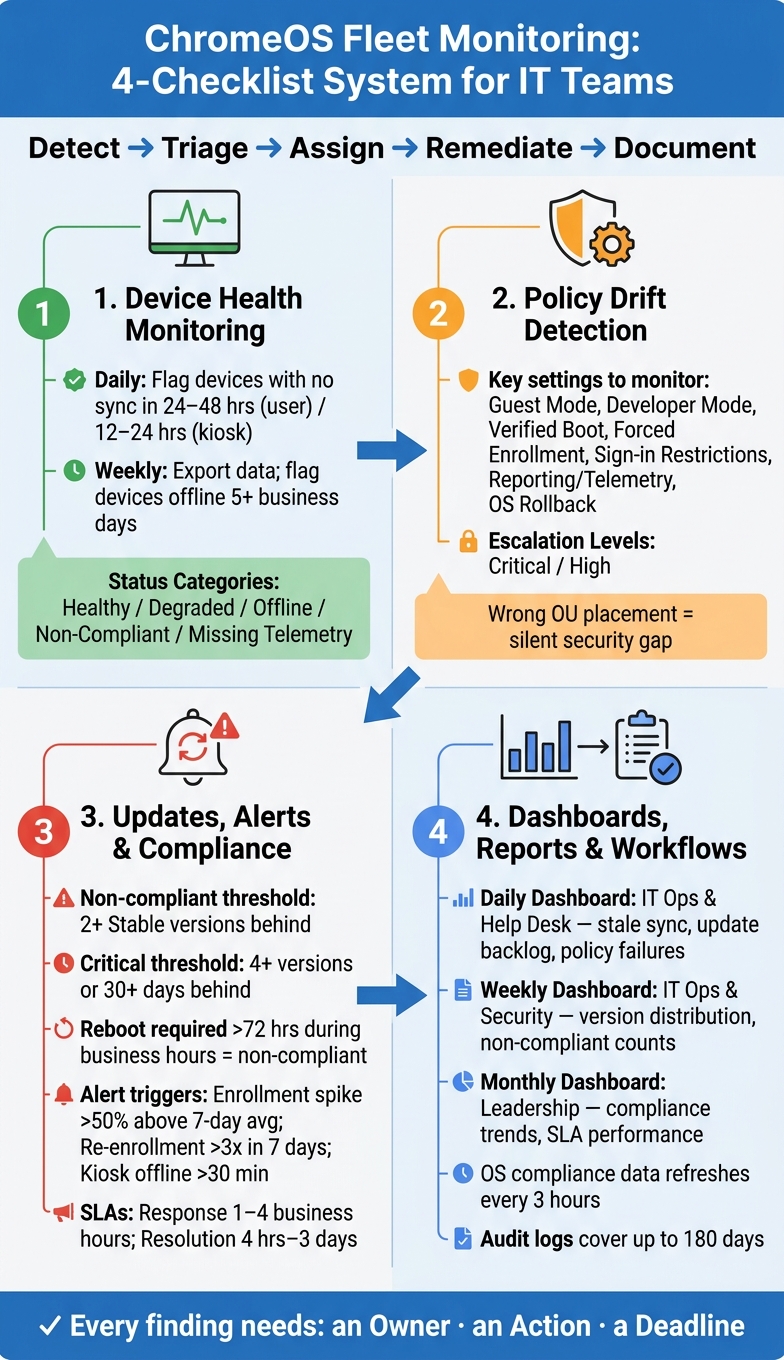
ChromeOS Fleet Monitoring: 4-Checklist System for IT Teams
Chrome Enterprise Customer Training Series: Admin Console overview and best practices
sbb-itb-c68f633
Checklist 1: Monitor Device Status and Health
With reporting and telemetry turned on, the next move is simple: build a steady review habit.
Daily Checks: Status, Sync, and Telemetry
Start each morning in Devices → Chrome → Devices. Open the devices requiring attention view first. Then scan the Last sync column and flag any device that hasn't checked in during the past 24 hours while the business day is in progress.
Next, look at battery health, storage, CPU load, network connectivity, enrollment state, and alert flags. This helps you tell the difference between a device that's just powered off and one that's starting to fail. Chrome Management Telemetry also shows fields like battery remaining capacity, Wi-Fi signal strength, and last reboot time. Use those fields to spot anything that falls outside your fleet's normal range.
Weekly Checks: Offline Patterns, Kiosk Health, and Re-Enrollment Issues
Once a week, export device data and filter for devices that didn't sync on any standard business day that week. If a device misses five business days, it's often lost, reassigned, or unenrolled. Cross-check it against asset records, then contact the assigned user or site contact.
For kiosk OUs, make sure devices are online during expected hours, running the right app version, and not showing repeat crash or forced-reboot events. Also review re-enrollment frequency. Repeated new enrollments often point to resets, repairs, or unauthorized use, and they deserve a closer look.
Table: Device Status Categories, Symptoms, and Next Steps
Use the table below to triage devices the same way each time inside Google Admin.
| Status | Typical Symptoms | Where to Verify in Google Admin | Immediate Next Step | Resolution Window |
|---|---|---|---|---|
| Healthy | Recent sync; current OS version; normal telemetry | Devices → Chrome → Devices | No action required | Ongoing monitoring |
| Degraded | Sync gaps of 2–3 days; battery warnings; high CPU; minor update lag | Device details panel; telemetry fields | Review telemetry; contact user; schedule maintenance | 2–3 business days |
| Offline | No sync for 5+ business days; no telemetry activity | Last sync field; activity history | Cross-check asset records; contact user or site; assess for loss or theft | Investigate within 1–2 business days |
| Non-Compliant | Outdated OS version; disabled auto-updates; missing or blocked telemetry | OS version report; policy settings view | Reapply policies; force re-check via sign-out/sign-in; escalate high-risk cases | Remediate within 1–3 business days |
| Missing Telemetry | Device appears enrolled but shows no health data or stale records | Device details; OU reporting settings | Verify OU policy; have the user reconnect during business hours; consider re-enrollment | Promptly |
A device with recent activity but a stale Last sync usually points to a reporting or enrollment problem, not just a device that's offline.
Use these health checks to separate hardware trouble from policy drift in the next checklist.
Checklist 2: Detect Policy Drift and Risky Settings
Policy drift usually sneaks in. A device lands in the wrong OU, one setting gets overridden, reporting turns off, and nobody notices until something fails. The job here is simple: catch those gaps before they turn into incidents. A device may look fine on the surface and still be out of policy.
Identify the Settings That Must Stay Fixed
Some ChromeOS settings are too sensitive to leave unchecked. If any of these drift from baseline, treat it as an immediate issue:
- Guest mode - should be disabled or tightly restricted on managed devices. Guest sessions can create unlogged access to company resources.
- Sign-in restrictions - should limit logins to your managed domain or approved groups. If a device accepts accounts outside your domain, access control gets much harder to manage.
- Forced enrollment - every device should be enrolled and stay enrolled. Unenrollment events should be rare and always documented.
- Developer mode - should be disabled for production OUs. Developer mode can let users bypass management controls and install unapproved software.
- Verified boot - should stay enabled. It helps confirm the OS hasn't been tampered with.
- OS rollback controls - should stay disabled outside test OUs. Rolling back can bring old flaws back into play.
- Reporting and telemetry - keep OS information, hardware information, telemetry, user tracking, kiosk session status, and system log upload enabled.
Also confirm that each device sits in the correct OU. Wrong placement means the wrong policy set gets applied. That can create a security gap with no clear error message on screen.
Review Drift Indicators and Risky Configuration Changes
Drift often shows up as stale policy syncs, missing telemetry, or odd values in device details. Use the same device details view to compare your baseline against current settings.
Check the Chrome Management policy pages and compare what is applied at the OU level with your documented baseline. Watch override vs. inherit behavior closely. A setting may look right in the top OU but still be overridden farther down the tree without any alert firing.
When you find a mismatch, document it right away: date and time, serial number or asset tag, intended OU, assigned OU, expected setting, current setting, last policy sync, and owner or assignee. That record helps with remediation and any audit review that comes later.
Table: High-Risk Settings, Monitoring Method, and Escalation Level
Use the table below to sort mismatches by risk and OU sensitivity.
| Setting | Risk If Misconfigured | Recommended Value | Where to Monitor in Google Admin | Escalation Level |
|---|---|---|---|---|
| Developer mode | Bypasses management controls; can allow unapproved software and system changes | Disabled for all production OUs | Chrome Management policy pages; device details | Critical on sensitive OUs; High elsewhere |
| OS rollback allowed | Can restore vulnerable OS versions and undo security fixes | Disabled except in test OUs | OS update policy reports; device details | High |
| Guest mode | Allows anonymous, unlogged access to managed resources | Disabled or tightly restricted | Chrome Management policy pages; device reports | High to Critical depending on OU |
| Sign-in restrictions | Permits logins outside the managed domain or approved groups | Restricted to the managed domain or approved groups | Chrome Management policy pages; user and browser settings | High |
| Verified boot | Lets tampered OS changes persist undetected | Enabled | Device reports; policy pages | Critical |
| Reporting / telemetry disabled | Reduces visibility into device health, compliance, and security events | Enabled | Reporting and metrics settings; device reports | Critical on any managed OU |
| Forced enrollment off | Devices can be wiped and used outside management | Enabled | Enrollment settings; device reports and audit logs | Critical |
Use these escalation levels as a starting point, then adjust based on how sensitive the OU is. The same drift issue should be treated more aggressively in sensitive OUs.
Checklist 3: Track Updates, Compliance, Alerts, and Remediation
After policy drift, the next big risk is old software. If devices fall behind, they stay open to problems you could have fixed with a normal update cycle.
Check OS Versions, Update Status, and Compliance Gaps
Review each device on a set schedule. Look at OS version, release channel, last update time, pending updates, reboot-required status, and the auto-update policy. A simple rhythm works well:
- Daily checks for kiosks and shared devices
- Weekly fleet reviews
- Monthly audits for unsupported versions
Set hard number-based rules so there’s no guesswork.
Any device more than two Stable versions behind the current ChromeOS release is at risk. Any device more than four Stable versions behind or more than 30 days behind is non-compliant. Reboots matter too. If a device shows reboot required for more than 72 hours during normal business hours, Monday through Friday, 8:00 a.m.–6:00 p.m. local time, treat it as non-compliant. Security fixes often don’t fully apply until the restart happens.
Track Auto Update Expiration (AUE) on its own. Any device past AUE should be flagged for replacement.
Alongside version data, watch these security checks:
- Safe Browsing enforcement
- forced re-enrollment
- verified boot
- sign-in restrictions
Set a baseline and stick to it. For example: Safe Browsing on, forced re-enrollment on, verified boot locked, and sign-in limited to the company domain. If a device is behind on updates or drifts from that baseline, put it in the same work queue. That keeps the process simple and stops one class of issue from getting ignored while another gets all the attention.
Once you’ve set the baseline, the next step is to turn repeat misses into alerts with a clear owner and a due date.
Set Up Alerts and Define Follow-Up Steps
Set alerts in four buckets: enrollment and re-enrollment activity, update backlog, version and policy non-compliance, and health anomalies like repeat crashes or odd offline behavior.
For enrollment, flag any daily total that jumps more than 50% above the prior 7-day average. For re-enrollment, if the same serial number is re-enrolled more than 3 times in 7 days, investigate it. That pattern can point to developer mode misuse, hardware trouble, or attempts to dodge policy.
Update backlog alerts should fire when a device stays in pending update or reboot required past your set window. A common rule is 72 hours for user devices and 24 hours for kiosks.
Use the same response flow each time:
- Notify the user
- Force the reboot or update during off-peak hours
- Move devices that keep failing to a quarantine OU or send them for hardware review
Log every alert in the ticketing system. Include the owner, the action taken, and the closure time. That paper trail matters when someone asks, “Did we see this coming?” or “How long did it sit?”
Use this same response path for every alert type.
Table: Alert Types, Triggers, Notification Paths, and SLAs
| Alert Type | Trigger Criteria | Recommended Threshold | Channel | Owner | Response SLA | Resolution SLA |
|---|---|---|---|---|---|---|
| Enrollment spike | Daily enrollments exceed the 7-day average | >50% above 7-day average | Email / ticketing system | Endpoint management team | 4 business hours | 1 business day |
| Repeated re-enrollment | Same serial number re-enrolled multiple times | >3 re-enrollments in 7 days | Email / ticketing system | Endpoint management + security | 1 business hour | 4–8 business hours |
| Update backlog | Devices with pending update or reboot-required state | More than 72 hours for user devices; more than 24 hours for kiosks | Email / ticketing system | Endpoint management team | 4 business hours | 1–3 business days |
| Version lag | Device OS version behind current Stable release | More than two Stable versions behind for more than 30 days | Email / dashboard | Endpoint management team | 4 business hours | 1–3 business days |
| Device past AUE | Device hardware past Auto Update Expiration date | Any device past AUE date | Ticketing system / email | IT asset management | 1 business hour | 4–8 business hours |
| Security baseline drift | Missing required policy such as Safe Browsing or verified boot | Any deviation from the defined baseline | Email / security dashboard | Security team | 1 business hour | 4–8 business hours |
| Offline anomaly | Device offline beyond the expected window | About 30 minutes for managed kiosks | Email / SMS | Endpoint management team | 1 business hour | 4 business hours |
Review thresholds every month. If alerts get noisy or teams keep missing SLAs, adjust the numbers. A threshold that looks good on paper can turn into pure inbox clutter in daily use.
Push these alerts into shared dashboards so IT and security are looking at the same backlog, not two different versions of the story.
Checklist 4: Build Dashboards, Reports, and Follow-Up Workflows
Build three dashboard views: daily operations, weekly compliance, and monthly leadership.
Each team needs a different lens. IT ops needs signals tied to fixes. Security needs signals tied to compliance. Help desk needs ownership details and ticket context. Leadership needs trend lines and SLA metrics. The goal is simple: turn the alerts from Checklist 3 into work that gets done.
Your core metrics should stay the same across all three views, even when the level of detail shifts. At a minimum, track stale sync counts, OS update backlog, policy drift, and non-compliant devices by OU. Those are the same categories used across this article, so reporting stays consistent instead of turning into apples-to-oranges comparisons.
Use U.S. number formatting in every dashboard. For example, show 1,250 devices or 12.5% non-compliant. Pair those numbers with plain time windows like last 24 hours, last 7 days, and month to date so nobody has to guess what they’re looking at.
| Dashboard View | Audience | Key Metrics |
|---|---|---|
| Daily | IT Ops, Help Desk | Devices requiring attention, stale sync counts, OS update backlog, policy check failures |
| Weekly | IT Ops, Security | OS version distribution by OU, recurring offline devices, non-compliant device counts, repeated escalations |
| Monthly | Leadership, IT Ops | Compliance rate trend, update adoption speed, open incidents by category, SLA performance |
Google Admin surfaces this data through Devices > Chrome > Devices for day-to-day operations and Reporting > Devices plus Audit and investigation for fleet-level summaries. That gives you one place to watch what’s happening now and another to spot patterns over time.
ChromeOS OS version policy compliance status refreshes every 3 hours, which keeps daily dashboards close to the current state. Device audit activity reports can cover up to the last 180 days, which makes monthly trend tracking much more dependable.
Standardize Reporting and Cross-Team Follow-Up
Use the same reporting path for every exception. If the path changes every time, things slip through the cracks.
Every recurring report needs three things:
- an owner
- an action
- a deadline
IT operations should get reports built for remediation: device IDs, affected OUs, failure reason, and the next step to take. Security should get reports focused on non-compliance, risky settings, and devices that missed updates or show suspicious drift. Help desk should get user-facing exception lists, recent ticket context, and assignment changes so they can move fast. Leadership should get a short monthly summary with trend lines, risk reduction progress, and SLA performance.
For follow-up workflows, keep the sequence the same every time: detect, triage, assign, remediate, document.
Start by confirming the issue is real and not just a temporary status blip. Then assign ownership. IT ops may isolate the device or push a fix. Security may correct a policy. Help desk may contact the user or handle an account reset.
After that, create or update a ticket with the device ID, user, OU, timestamp, symptom, and corrective action taken. Log each incident timeline in local U.S. time, including the detection timestamp, acknowledgment time, remediation start, and closure. That kind of consistency is what makes SLA tracking and audit prep useful instead of a last-minute mess.
Your runbook should spell out four remediation scenarios: device isolation, account reset, policy correction, and re-enrollment.
Use AdminRemix to Support Fleet Reporting and Asset Follow-Up
When Google Admin flags a problem, use AdminRemix tools to tie it back to assets, users, and bulk follow-up work.
AdminRemix tools help connect ChromeOS alerts to asset history, user assignments, and large remediation tasks.
- AssetRemix (adminremix.com) links flagged ChromeOS devices to asset history, lifecycle status, and help desk work, so your team can see whether a device is a new issue or part of a repeat pattern.
- Chromebook Getter exports Chromebook metadata into Google Sheets for bulk editing, reporting, exception tracking, and large remediation batches. It generates OS version and AUE reports across multiple OUs fast, so teams can edit fields in bulk and push changes back instead of updating devices one by one in the Admin Console.
- User Getter matches user metadata with device assignments during remediation, which helps teams clear up mismatches, ownership questions, and reporting gaps faster.
Together, these tools cut down the manual handoff between monitoring and action. And that handoff is usually where fleet reporting routines start to fall apart quietly.
Conclusion: A Repeatable ChromeOS Monitoring Routine for IT
In Google Admin, these checks only work if they happen on a set schedule with clear ownership. Turn each checklist into a recurring task, give it one owner, and set one deadline. IT ops, endpoint management, security, and the help desk should each have a named role in the rhythm of the work - not a vague shared duty that ends up belonging to no one.
Monitoring only matters when it leads to action. Every finding should result in a ticket, a correction, a re-enrollment, or a documented exception. If a finding just sits in a report and nothing happens, it adds noise instead of helping the team.
A strong routine cuts detection time, reduces unexpected incidents, improves OS compliance, and keeps policies aligned with fewer policy mismatches across OUs. If those metrics start getting worse, revisit your thresholds, adjust alert rules, or shift ownership where needed.
ChromeOS fleet monitoring works best when it’s structured, scheduled, and carried through. The teams that get the best results treat monitoring like a repeatable system, not a one-time audit.
FAQs
How do I set ChromeOS monitoring thresholds for different device types?
Start by organizing devices into Organizational Units (OUs) in the Google Admin console. That gives you a simple way to apply different policies and monitoring rules to each device group instead of treating every Chromebook the same.
From there, keep an eye on update status with the OS version policy compliance value. Use the Automatic updates until dashboard to watch AUE dates, and set up alerts for issues that need fast attention, like failed syncs or devices running an outdated OS.
If you want more detailed reporting at the OU level, Chromebook Getter can help.
What should I do first when a Chromebook stops syncing or shows stale telemetry?
First, check your reporting settings in the Google Admin console under Devices. Make sure Report device OS information, Report device hardware information, and Report device telemetry are turned on.
If those settings are on, open the device details page and look for any error notices. You can also run a manual sync or compare the last sync date in your asset records, such as Chromebook Getter, to figure out whether this is a one-off issue or part of a larger pattern.
How can I reduce alert noise without missing real ChromeOS issues?
Use targeted monitoring and plan ahead on maintenance. In the Google Admin console, set up automated alerts for critical events, such as unauthorized super admin assignments or failed sync jobs.
It also helps to spread out updates and use blackout windows so your network doesn’t get clogged up and set off false alerts. You can use Chromebook Getter to build reports on OS versions and AUE dates, which makes it easier to focus on actual device health issues instead of generic noise.